Black-Scholes-Merton Calculators, Designed for Simplicity & Precision,
Quantify and Control Your Risk:Reward
Stop guessing. Start trading with precision.
My Black-Scholes-Merton Options Trading Calculators give you the same quantitative edge used by professional traders — without the complexity, without the monthly subscription fees and without the learning curve.
Built over three years and battle-tested by traders at every level, these calculators are streamlined, fully unlocked and thoroughly documented. Beginner-friendly. Professionally robust.
This site also doubles as a complete Options education resource — Greeks: Delta, Gamma, Theta, Vega and Rho, Strategies, Moneyness, Intrinsic and Extrinsic Value, 0DTE Trading and more — including insights drawn from real trading experience. Some of it hard-won: The 10-Leg Master P/L Strategiser exists because of multiple Strangles with catastrophic long positions triggered by the worst UK retail sales figures on record. Sometimes the best tools are born from the worst trades.
Explore the four calculators below. Enjoy!
The World's First Professional Black Scholes Merton 10x Leg Option P & L Master Strategiser (Apple Numbers Desktop Spreadsheet)
Welcome to the home of the 10x Leg Option Profit & Loss Master Strategiser Calculator in Apple Numbers, a tool I built to fill a crucial gap in Options Trading analysis. As an active trader, I found that existing solutions fell short when it came to managing complex strategies and modelling future "What If" Scenarios involving multiple Option legs and positions. That's why I created this Options Trading Calculator — the first of its kind to simultaneously track Profit & Loss for up to 10 Option legs or underlying hedges.
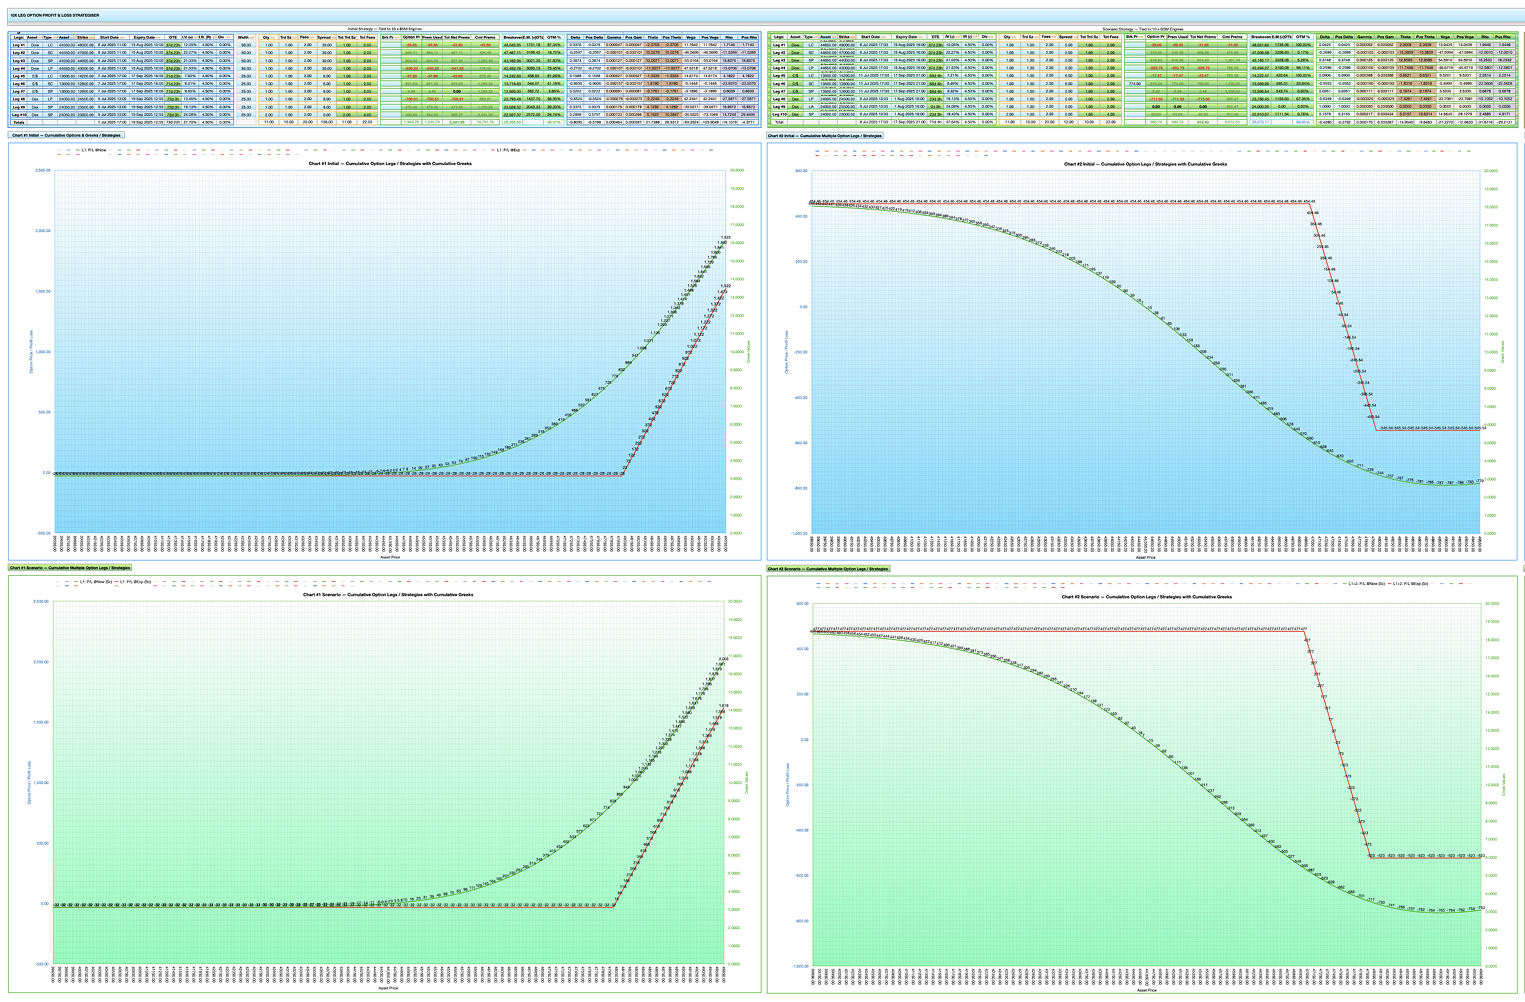
You can dive deep into your trading strategies with unprecedented precision and accurately model "What-If" scenarios. Make the changes in the separate green bordered "Scenario" table (at the top of the sheet), with different BSM inputs from those "Initial" BSM inputs entered in the top left blue bordered table. 20x independent Black-Scholes-Merton (BSM) engines precisely calculate Option Prices, Greeks and P/L.
For more details on the 10x Leg Option P/L Master Strategiser (in Apple Numbers) Click Here.
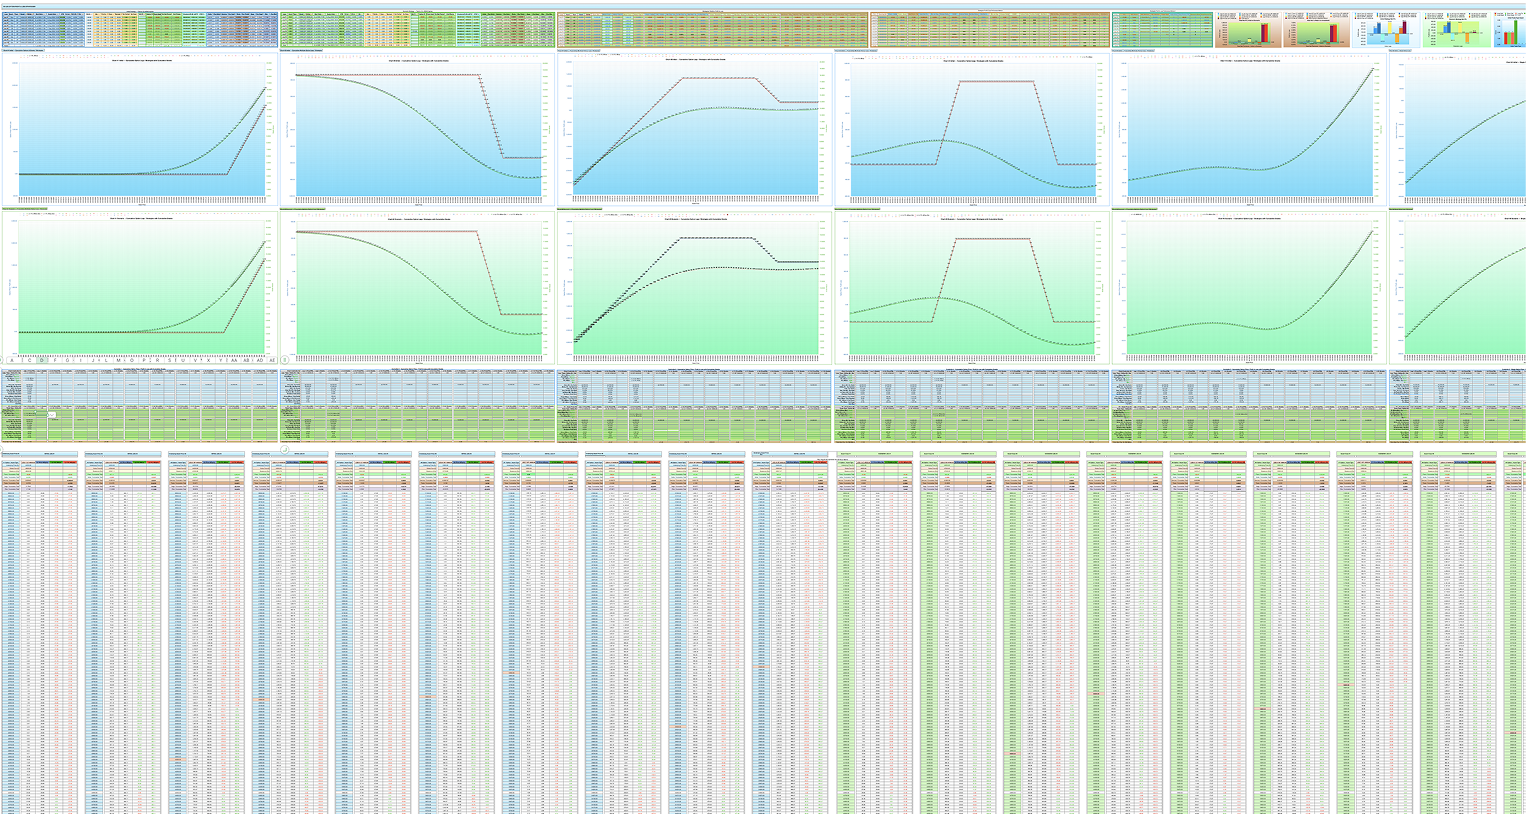
The blue charts show your Initial Positions and the green charts plot Scenarios. Charts come with advanced charting capabilities for both single positions and cumulative strategies. Drop-down menus allow for rapid plotting of real-time and expiry-based P&L, giving you the clarity you need to make informed decisions quickly. I designed this tool to be more than just a calculator — it's a strategic asset. You'll get full Greek analysis, comprehensive Risk Metrics and a separate sheet with 30x BSM calculators, the top 20 displaying current Legs, the bottom 10 to price Options with confidence.
NOTE: All my Options Trading Calculators come with full detailed Instructions and also Comments (see yellow triangles in the top of some cells), explaining every aspect from simple definitions to complex descriptions of the dynamics between different Greeks. All sheets are unlocked and customisable.
Overview of BSM 10x Leg Option P/L Master Strategiser with Greeks (Higher resolution images can be found in the Product Pages)
Black-Scholes-Merton Single Options Pricing Calculator (x8 Large Charts & x72 Greeks Charts)
Welcome to the Advanced Black-Scholes-Merton (BSM) Single Options Pricer Calculator, designed to give traders the power to control risk with precision and confidence. This unique option pricing tool helps you make informed decisions by providing real-time insights into Profit & Loss, Delta probabilities, Gamma risk, and key metrics like Theta and Vega for Option short sellers. With intuitive spreadsheet charting available in both Apple Numbers and Excel, you'll be equipped to manage your full risk exposure across a wide range of asset prices.
Whether you're navigating complex market conditions or looking to fine-tune your strategy, this calculator offers both beginner-friendly simplicity and the advanced features experienced traders need. Available with two BSM calculators — the large pale blue charts for plotting Asset Prices (x-axis) and gold charts for targeting Premiums using different Strike Prices (x-axis) — this powerful tool will help you take control of your risk.
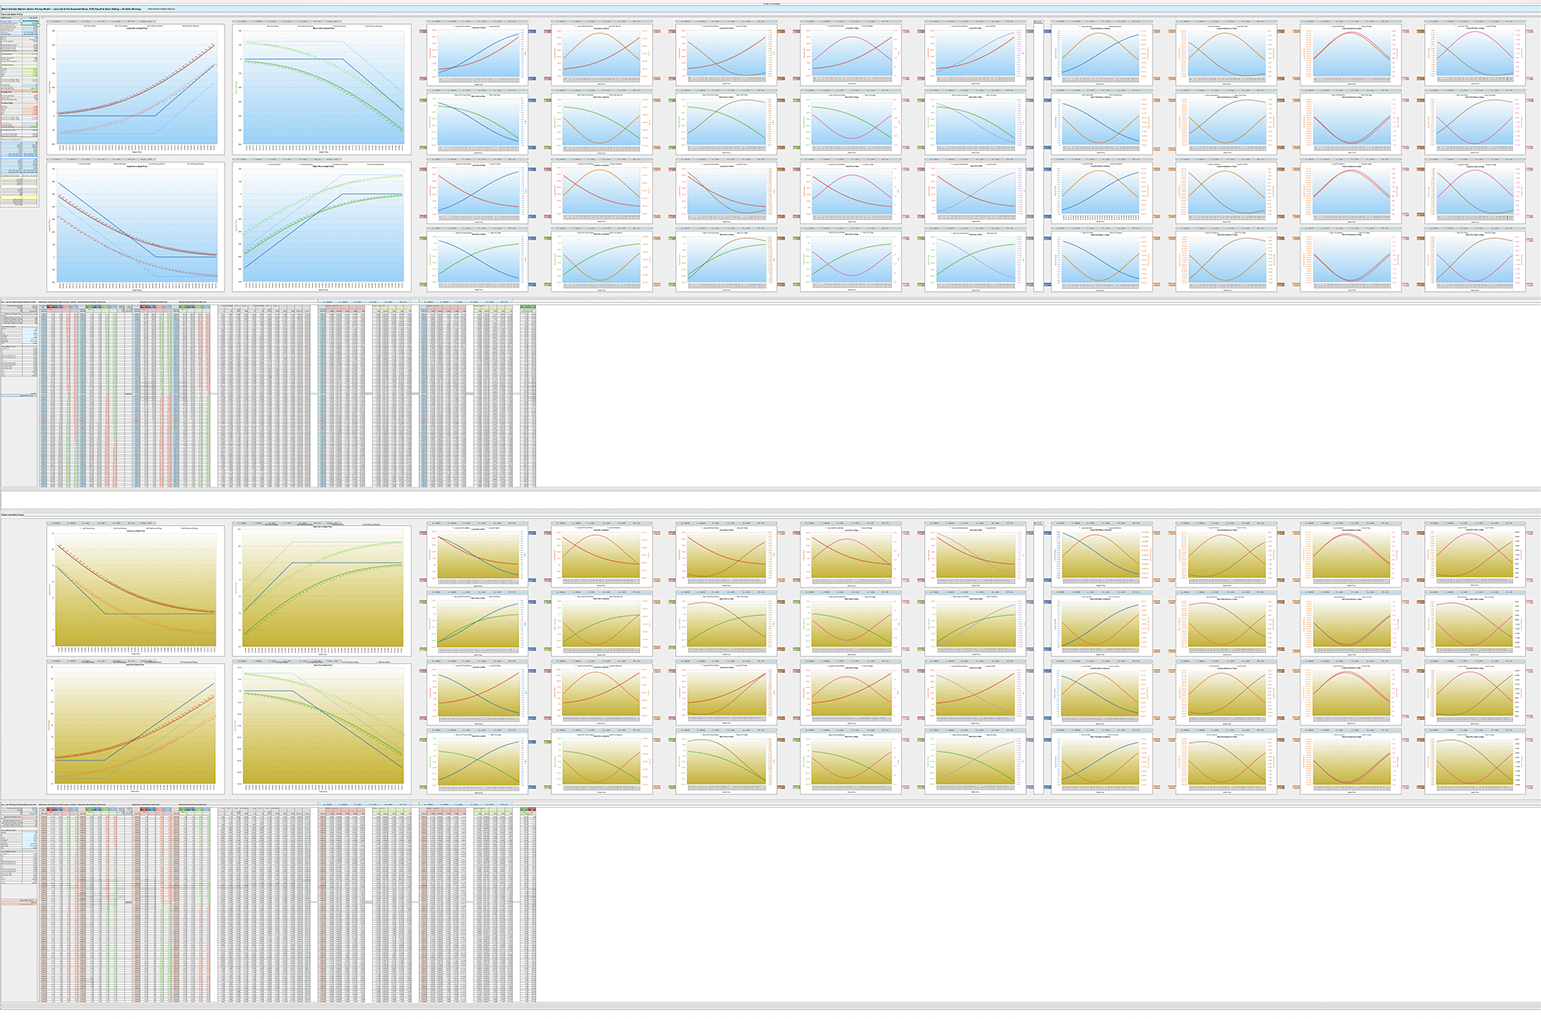
The BSM Options Trading Calculator features charting for Long and Short Calls and Puts, displaying @Now (live) and @Expiry pricing and Profit & Loss data along with 72 Greek charts for a deep dive into Delta, Gamma, Theta, Vega, and Rho. It also offers precise option pricing, implied volatility projections, and Probability of Profit (POP) calculations to ensure you're always trading with the odds on your side.
The Options Trading Calculator also allows traders to calculate Premiums from 0DTE (0 Days to Expiry), 1DTE, 2DTE etc, as well as Weekly, Monthly and Yearly Expiries and longer. It includes Expected Market Move calculations for whatever time period it's set to, all the way down to the final minutes before expiry. Work out Expected Moves from an Hourly to Yearly basis giving 68.2%, 95.4%, 99.7% Confidence Levels.
Designed for traders who need speed, accuracy and ease of use, the BSM (with Dividends) Options Trading Calculator is perfect for pricing, assessing risk, and staying ahead of market moves. Download today and take control of your Options Trading Strategies.
Overview of BSM Option Pricer with Greeks. (Higher resolution images can be found in the Product Pages)
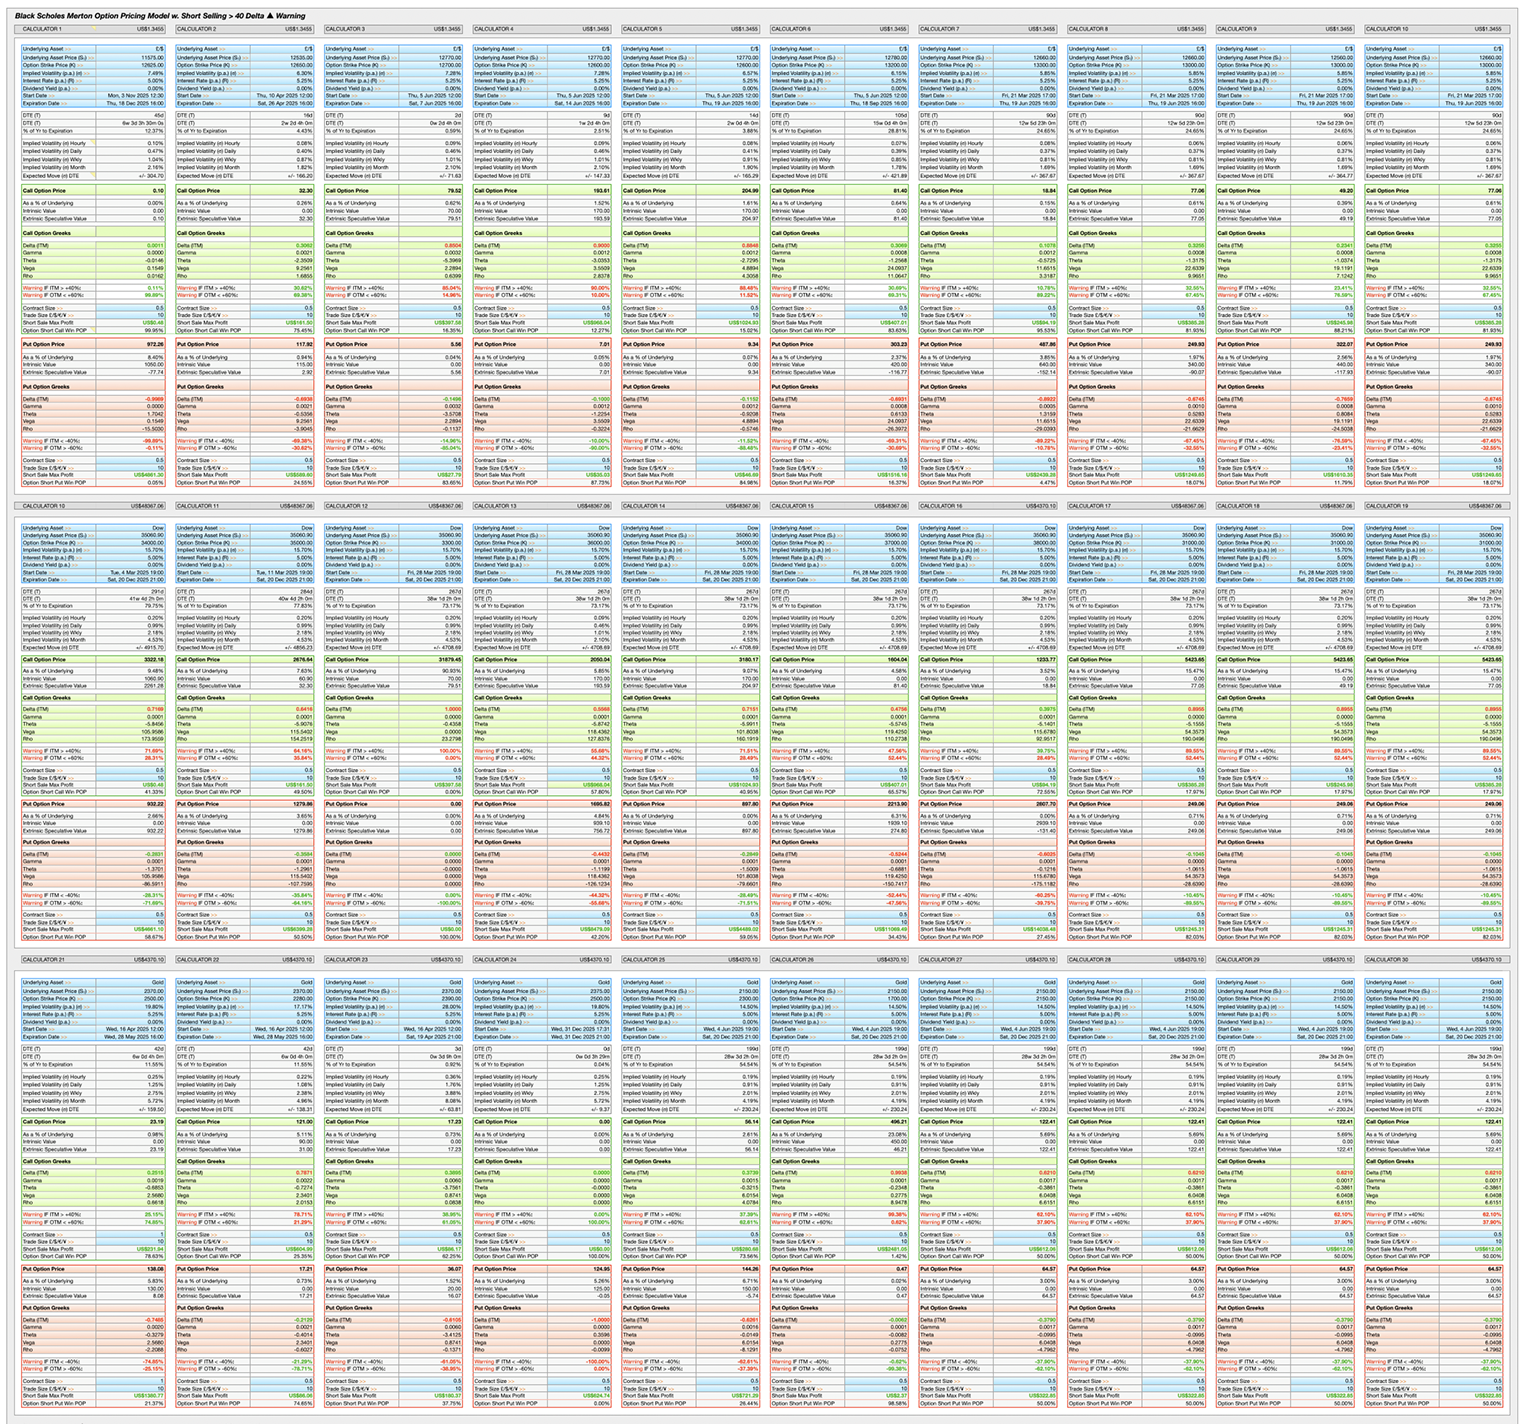
Black-Scholes-Merton Option Pricing Calculators (30x Banks)
Introducing the Black-Scholes-Merton Options Pricing Calculator Banks (with Dividends), a powerful toolset designed to give traders precise control over market risk. This comprehensive Apple Numbers and Excel based calculator set includes 60 individual BSM calculators across two visually distinct themes — 30 banks in a Light coloured theme and 30 banks in a Dark Blue theme — allowing you to choose the interface that best suits your preferences.
Key Features Recap: Accurate Option Pricing to 2 decimal places, enabling you to verify whether your broker is under or overpricing options. Implied Volatility Projections for hourly, daily, weekly, and monthly market moves, offering a complete view of potential price swings. 0DTE Capabilities: Calculate option premiums right down to the last minutes before expiry for real-time decision-making. Expected Market Move: Estimate how much an asset is likely to move over any given timeframe, from minutes to months, based on probabilities of 68.2%, 95.4%, and 99.7%.
Live @Now Pricing: Set Option start dates to the current moment to monitor real-time price changes. Delta Warning: Get a red alert when OTM Delta falls below 60%, helping short sellers stay on top of risk. Multi-Bank System: Each Numbers sheet includes 30 calculators (3 rows of 10), each Excel sheet includes 24 calculators (3 rows of 8) minimising repetitive data entry and enabling quick analysis across multiple assets for a range of different DTE's.
Designed for traders who need speed, accuracy and ease of use, the BSM with Dividends Options Trading Calculator is perfect for pricing, assessing risk, and staying ahead of market moves. Download it today and take control of your options trading strategy!
Overview of BSM 10x3 Calculator with Greeks Data (light blue version). (Higher resolution images can be found in the Product Pages)
Black-Scholes-Merton Implied Volatility Calculators - Newton-Raphson & Bisection (10x Banks)
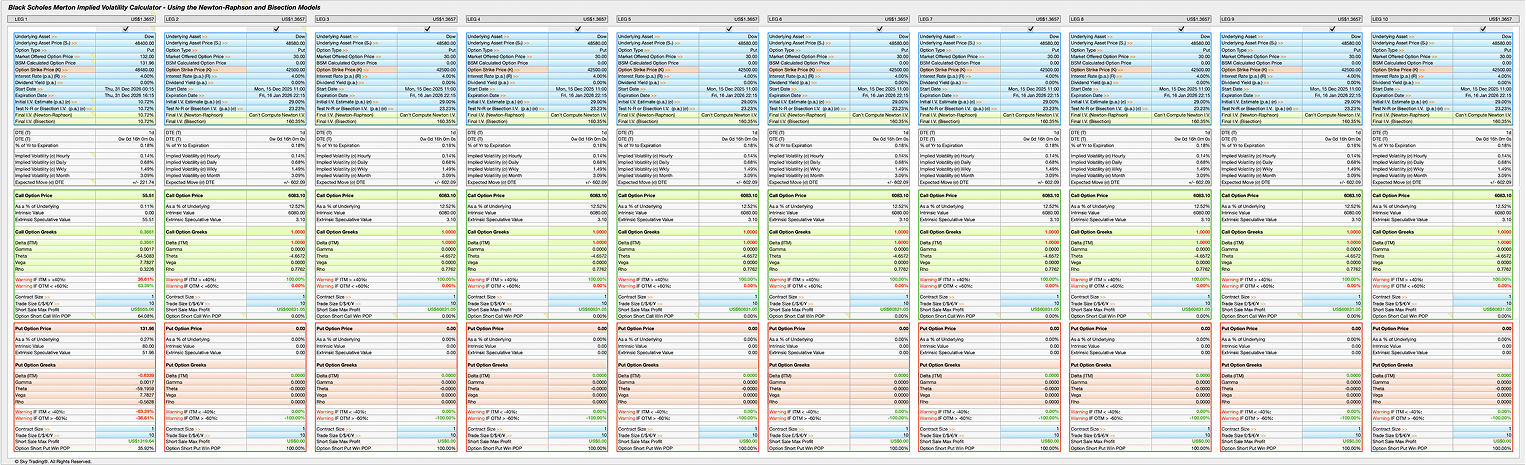
The Black-Scholes-Merton Implied Volatility Options Pricing Calculators (with Dividends) calculate the Implied Volatility percentage given the set BSM inputs. The I.V. calculator set includes 10 individual BSM calculators in Excel and Numbers and uses two robust methods — the Newton-Raphson and Bisection models to derive the I.V. percentage. Implied Volatility is not a forward-looking scenario input. It is a backed-out parameter from an Option price that already exists in the market.
Key Features Recap: Accurate I.V. Pricing to 2 decimal places, using two mathematical solutions: The Newton-Raphson and Bisection models. In the event that the Newton-Raphson model fails to derive the I.V., the calculator uses a second calculation method — the Bisection model — to find the given Implied Volatility. 0DTE Capabilities: Calculate I.V. right down to the last minutes before expiry for real-time decision-making.
The I.V. percentage result answers this question: "Given today's Spot (S), Strike (K), Time (DTE), Interest Rates — What volatility must the market be implying in order to justify the observed Option price?" It does not answer: "What I.V. will occur if the Spot moves to X?"
Purpose / Use: Comparing Option prices, find Option mis-pricing and Volatility surface analysis. Input: The Option Price and other typical BSM Inputs like Spot (S), Strike (K) and Start and Expiry Dates. Output: Implied Volatility (I.V.).
For more details on the Black Scholes Merton Implied Volatility Calculators (10x Banks) Click Here.
Overview of BSM Implied Volatility Calculator with x10 Banks. (Higher resolution images can be found in the Product Pages)