
Option Greeks Explained 101:
The Best Guide to Understanding Delta, Gamma, Theta, Vega & Rho
What are Option “Greeks?”
Greeks Overview:
Option prices (premiums) are not linearly related point by point to price movements in the underlying market. They exhibit convexity and if you look at any option graph, whether depicting the @Now Live Option Price or its @Expiry Price, that becomes apparent. The rate of change in an option price will increase or decrease in points by a greater magnitude than the change in points of the underlying asset.
Option Greeks are mathematical measures that describe how different factors will affect the price of an Options contract. These factors include changes in the Underlying Asset's Price, Time to Expiry, Volatility, Interest Rates. The Greeks are essential for traders to understand the risks and potential rewards of Options trading.
Delta Explained in Detail:
1. Delta (Δ): Sensitivity to Changes in Price
What it Measures:
Delta measures the theoretical rate of change in an Option's Price relative to a 1 unit or $1 move in the Underlying Asset Price. Delta represents the ratio of change, regardless of whether we're measuring in units or dollars. It describes the relationship between a 1 unit move in the underlying and the resulting change in the option's value.
Delta Ranges: Between -1 and +1 for standard options.
Overview of Delta for a Long Call:
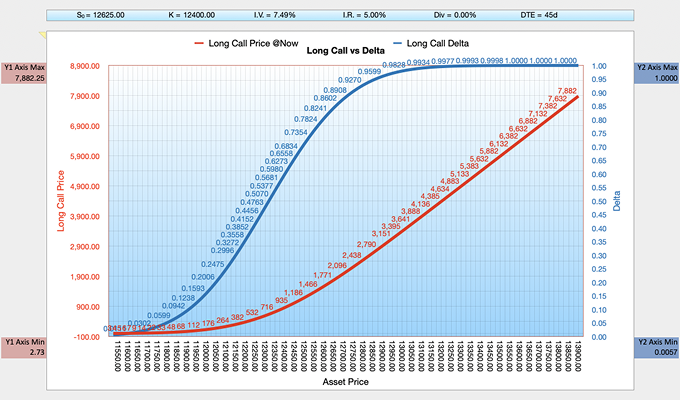
- Asset price ↑ then Call Delta tends to go up ↑
- Asset price ↓ then Call Delta tends to go ↓
Positions have positive Delta and range between 0 and +1, with +1 indicating In-the-Money (ITM) status. Delta is typically quoted to 4 decimal places. (Mnemonic: "ITM" options head to "one," "OTM" options head to "zero.")
Overview of Delta for a Long Put:
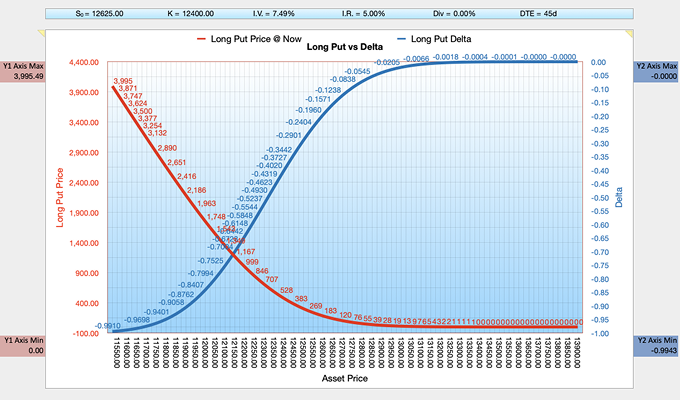
- Asset price ↑ then Put Delta tends to go ↓
- Asset price ↓ then Put Delta tends to go ↑
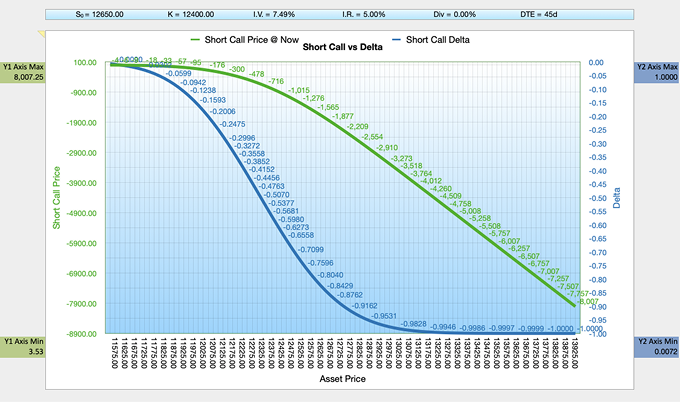
Points to Note from the Charts, particularly for the Short Call and Put Charts:
- The non-linear relationship between the underlying price movement (x-axis) and option value.
- The option price green line losses get steeper and faster the more the Option becomes In the Money (ITM).
- Why Short Calls and Puts have theoretically unlimited loss potential (that continuing downward slope!).
- How Delta changes across different "Moneyness" levels.
Overview of Delta for a Short Call:
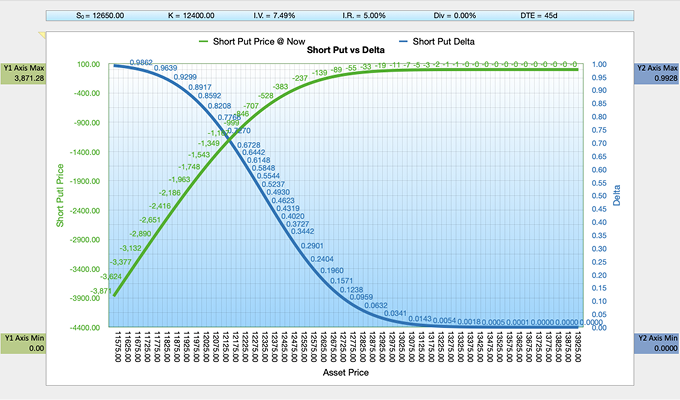
Overview of Delta for a Short Put:
1. Importance of Delta:
It helps traders understand how much the option price will change for a 1 unit move in the underlying asset.
- Long Calls and Short Puts have +ve Delta.
- Long Puts and Short Calls have -ve Delta.
Example 1: Long Call. A Delta of +0.7 (ITM) means the option price will rise by $0.70 for every $1 increase in an underlying stock. E.g. Apple Stock increases from $225 to $226, a Long Call option will increase by 70 cents.
Example 2: Long Put. A Delta of -0.3 (OTM) means the option price will fall by $0.30 for every $1 increase in an underlying asset. E.g. Apple Stock increases from $226 to $230, a Long Put option will decrease by $1.20 ($4 × $0.30 per $1 dollar move).
Example 3: Short Call. A Delta of -0.1 (Deep Out-the-Money, OTM) means the option position will lose money as the underlying asset price increases. The price for the Long Call will rise by +$0.10 for every $1 increase in the underlying asset.
Indices like the S&P 500 are quoted in points, e.g.:
S (Spot) = 5,875 (15th Nov. 2024).
K (Strike) = 6,150.
Premium = $880.
DTE = 30 (Days to Expiry).
Example 4: Short Put. A Delta of +0.2 means the option position gains in value as the underlying price increases. The option price Delta for a Long Put is -0.2, because a Put option gains in value as the underlying asset price decreases. The Short Put will increase by +$0.20 for every $1 increase in the underlying asset. If the underlying (S) £/$ is trading at 1.2620 and your Strike (K) = 1.2900 and pays a premium of $280, then if the £/$ rises $0.0100 (1 cent) to Spot 1.2720, the value of the Call option will increase against you by an extra $28, making the new premium equate to $308.
2. Magnitude of Delta:
(i) Long Calls and Short Puts:
- Out-of-the-Money (OTM): Delta is closer to 0, but still positive.
- At-the-Money (ATM): Delta is around +0.5.
- In-the-Money (ITM): Delta approaches +1.0.
(ii) Long Puts and Short Calls:
- Out-of-the-Money (OTM): Delta is closer to 0, but still negative.
- At-the-Money (ATM): Delta is around -0.5.
- In-the-Money (ITM): Delta approaches -1.0.
3. Importance of Delta — Probability of Success:
Delta also serves as an approximate estimate of an option's likelihood to expire In-the-Money (ITM). For example, an Option with a Delta of +0.4 has a 40% chance of expiring ITM and a 60% chance of expiring OTM.
4. Calculating Delta:
Delta = (On − Oi) / (Sn − Si) where:
- On = The new value of the option
- Oi = The initial value of the option
- Sn = The new value of the underlying asset
- Si = The initial value of the underlying asset
For example: Suppose an underlying stock XYZ was trading at $520 per share and a Call option with a Strike price of $500 was trading for $45. This Call option is In-the-Money because the stock price is above the Strike price. If the price of XYZ stock rises to $523, and the value of the Call option rises to $46.80, the delta of this option is:
Delta = ($46.80 − $45.00) / ($523 − $520) = +0.6
Overview — Delta for a Long Call vs 7 Different Days to Expiry:
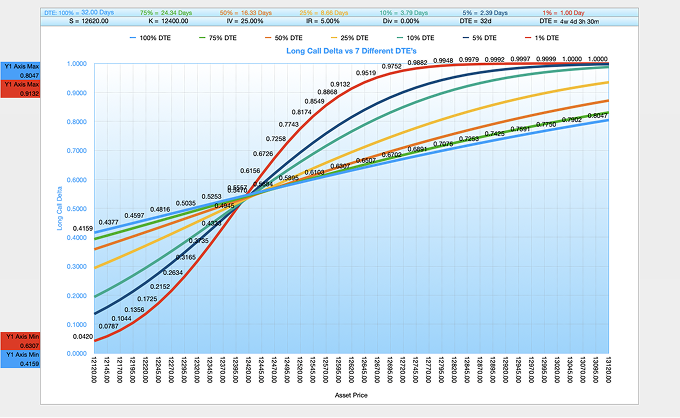
Long Calls: The effect of Days to Expiry on Delta. The DTE = 32 days.
7 different DTE's are plotted with 100% representing the 32 DTE's inputted into the BSM calculator:
- 100% DTE = 32 days
- 75% DTE = 24 days
- 50% DTE = 16 days
- 25% DTE = 8 days
- 10% DTE = 4 days
- 5% DTE = 2 days
- 1% DTE = 1 day
The chart gives a good visualisation of how Delta behaves across different Days to Expiry (DTE) for a Long Call. As can be seen with this extremely short Days to Expiry, Delta changes rapidly, as will the option price, the shorter the life of the option contract.
Key Observations:
1. Relationship Between Time Decay (Theta) and its Impact on Delta:
- Shorter DTE's (dark blue/red lines, 1–8 days) show much steeper curves.
- As expiry approaches, Delta becomes more binary (closer to 0 or +1).
- Longer DTE's show more gradual Delta changes.
- This demonstrates options becoming more "digital" near expiry, where signals are either "on" (1) or "off" (0). Very short-dated options behave similarly — they're either going to finish ITM (1) or OTM (0) with little time left for price movement to change this outcome. This binary-like behaviour makes them especially risky to trade.
2. Behaviour Across Moneyness:
- All curves intersect near Delta 0.5. At 32 DTE, the Delta of the option is around 0.5827, meaning the option will move approximately 0.5827 for every $1 change in the underlying asset price.
- Shows that ATM options have approximately (~) 0.5 Delta regardless of time to expiry.
(i) ATM Behaviour (around K = 12500):
(ii) ITM/OTM Behaviour:
- Deep ITM converges to 1.0 Delta for all terms. As the option moves further ITM, the Delta approaches 1, indicating that the option becomes more sensitive to changes in the underlying asset price.
- Deep OTM converges to 0.0 Delta for all terms.
- Shorter-term options reach these extremes much faster.
3. Rate of Change of Delta:
- Near-term options (1% DTE, ~8 hours) show almost vertical transitions.
- The 32-day longest dated option (blue line) is much more gradual.
- Shows why Gamma risk is much higher in short-dated options:
- Gamma measures how much an option's Delta changes when the underlying price moves.
- The Delta curve is very steep, almost vertical near the Strike price.
- This means a small move in the underlying price causes a large change in Delta - for example, a 75 point move from 1.2470 to 1.2545 could change Delta from -0.15 to -0.9 very quickly.
- This rapid Delta change is high Gamma in action.
- The Delta curve is much more gradual.
- The same 75 point move might only change Delta from -0.55 to -0.65.
- This slower Delta change represents lower Gamma.
- This matters for risk management because:
- With high (short-dated) Gamma your position's directional exposure (Delta) can flip dramatically with small price moves.
- This making hedging much harder.
- This is why many traders avoid selling options in the last week before expiration.
- You have less time for the position to recover if it moves against you.
- This is why many traders avoid selling options in the last week before expiration - the Gamma risk becomes too extreme to manage effectively.
(i) For short-dated options (orange/red lines):
(ii) For longer-dated options (blue line = 32 days):
4. Risk Management:
- Shows why short-dated options are more dangerous/volatile.
- Longer-dated options provide more predictable Delta exposure.
- Demonstrates why Gamma risk increases dramatically near expiry.
- The chart highlights why trading very short-dated options is risky - those near-vertical Delta changes in short-dated options can quickly turn a profitable position into a significant loss.
5. Summary:
Short DTE's cause high Delta values for ITM Options because the market perceives a high certainty that the underlying price will remain above the strike price (for Calls) or below it (for Puts). This reduces the probability of the Option moving OTM, pushing Delta closer to 1 (for ITM) or 0 (for OTM).
Overview — Delta for a Long Call vs 7 Different Implied Volatilities:

Long Calls: The Effect of Implied Volatility (IV) on Delta. The IV = 25%.
7 different IV's are plotted with 100% representing the 25% IV inputted into the BSM calculator:
- 100% of I.V. = 25% I.V.
- 75% of I.V. = 19% I.V.
- 50% of I.V. = 13% I.V.
- 25% of I.V. = 7% I.V.
- 10% of I.V. = 3% I.V.
- 5% of I.V. = 2% I.V.
- 1% of I.V. = 1% I.V.
The chart gives a good visualisation of how Delta (the likelihood an Option will expire ITM), behaves across different IV's for a Long Call. As can be seen with the extremely low 1% IV on the chart above, Delta changes rapidly, as will the option price, the lower the implied volatility.
Key Observations:
1. Relationship Between Implied Volatility (Vega) and its Impact on Delta:
- Implied volatility reflects the market's expectation of the magnitude of future price movements for the underlying asset.
- Lower IV means narrower price movement expectations, implying that the underlying price is less likely to move far away from its current level.
- Lower IV’s (see the dark blue and red lines, with 5% and 1% IV above) show much steeper curves.
- As IV approaches,1%, Delta becomes more binary (closer to 0, OTM or +1, ITM).
- Very low implied volatility options behave like this because they're either going to finish ITM (+1 ) or OTM (0) with little expectation of price movements to change this outcome. This binary-like behaviour where signals are either "on" (1) or "off" (0), makes them especially risky to trade.
2. Higher IV and the Probability Distribution:
- In a high-IV environment, the wider probability distribution means there’s a greater chance for the underlying price to move significantly in either direction: With IV = 25%: Delta might drop to around 0.80 because the underlying price's potential movement is much wider and there’s a higher probability the option may lose some or all of its intrinsic value.
- Higher IV’s (light blue line = 25%) show more gradual Delta changes.
- Even for a deep ITM call option, higher IV means there's a greater probability the underlying price could move below the Strike price (K), making the option less "certain" to stay ITM.
- This increased uncertainty lowers Delta because Delta is a measure of the likelihood that the option will expire ITM.
3. Behaviour Across Moneyness and Strike Price vs. Probability:
- All curves intersect near Delta 0.5. At 25% IV, the Delta at 12400 is approximately 0.5253 to 0.5470, meaning the option moves ~0.53 cents for every $1 change in the underlying. ATM options consistently have a Delta close to 0.5, regardless of IV.
- ITM Options: In high-IV environments, ITM options have a lower certainty of staying ITM, slightly reducing their Delta. For deep ITM options (Delta near +1 or -1), intrinsic value dominates, and the option behaves like the underlying asset.
- OTM Options: OTM options have higher probabilities of moving ITM in high-IV environments, increasing their Delta. In low-IV environments, OTM options are less likely to move ITM, reducing their Delta toward 0.
- Lower IV accelerates the convergence of Delta to its extremes (+1, -1, or 0), making options more sensitive to changes in the underlying price. High IV prolongs this transition, with time value (extrinsic value) playing a larger role.
(i) ATM Behaviour (around K = 12400): The IV lines don’t converge at the strike of 12400 because Delta is influenced by multiple factors: IV, time to expiration, and the underlying asset’s price relative to the strike.
(ii) ITM/OTM Behaviour:
4. Why Delta Increases for ITM Options:
- When IV is low, the probability distribution of the underlying asset's future prices becomes tighter (narrower bell curve).
- For an ITM Option, this concentration increases the probability that the Option will remain ITM at expiration, pushing Delta closer to 1.
- Example: A deep ITM Call with a strike price of $100 and an underlying price of $120 in a low-IV market is highly likely to stay ITM, so its Delta will approach 1.
- Conversely, for OTM Options, the narrower distribution decreases the chance of moving ITM, reducing Delta further.
5. Risk Management:
- For ITM Options, low IV increases Delta, making their prices behave more like the underlying asset. Traders holding ITM Options in low-IV conditions experience higher sensitivity to price changes.
- For OTM Options, low IV reduces Delta, minimising their sensitivity to underlying price changes, making them behave less like directional bets.
- Option Pricing:
- In low-IV markets, the tighter probability distribution makes ITM Options more valuable relative to OTM Options, reinforcing the Delta skew.
6. Summary:
Low implied volatility causes high Delta values for ITM Options because the market perceives a high certainty that the underlying price will remain above the strike price (for Calls) or below it (for Puts). This reduces the probability of the Option moving OTM, pushing Delta closer to 1 (for ITM) or 0 (for OTM).
Low IV: ITM options have higher certainty of staying ITM → Delta increases toward +1.0.
High IV: ITM options have lower certainty of staying ITM → Delta decreases slightly from +1.0.
Delta Impact — Monetary Effect of a +$1.00 Move:
Long Positions: Profit/Loss from +$1.00 Stock Rise
| Position | Moneyness | Initial Premium | Delta | New Premium (+$1 move) | P&L Impact |
|---|---|---|---|---|---|
| Long Call | ITM | $5.80 | +0.80 | $6.60 | +$0.80 Profit |
| Long Call | ATM | $3.00 | +0.50 | $3.50 | +$0.50 Profit |
| Long Call | OTM | $1.20 | +0.25 | $1.45 | +$0.25 Profit |
| Long Put | ITM | $5.50 | -0.80 | $4.70 | -$0.80 Loss |
| Long Put | ATM | $2.80 | -0.50 | $2.30 | -$0.50 Loss |
| Long Put | OTM | $1.10 | -0.20 | $0.90 | -$0.20 Loss |
Note: Long Calls benefit from price increases (+ Delta). Long Puts lose value when the price rises (- Delta). ITM options have higher Deltas and react more like the underlying stock, while OTM options have lower Deltas and lower sensitivity.
Short Positions: Profit/Loss from +$1.00 Stock Rise
| Position | Moneyness | Premium Collected | Delta | Buy Back Cost (+$1 move) | P&L Impact |
|---|---|---|---|---|---|
| Short Call | ITM | $5.80 | -0.80 | $6.60 | -$0.80 Loss |
| Short Call | ATM | $3.00 | -0.50 | $3.50 | -$0.50 Loss |
| Short Call | OTM | $1.20 | -0.25 | $1.45 | -$0.25 Loss |
| Short Put | ITM | $5.50 | +0.80 | $4.70 | +$0.80 Profit |
| Short Put | ATM | $2.80 | +0.50 | $2.30 | +$0.50 Profit |
| Short Put | OTM | $1.10 | +0.20 | $0.90 | +$0.20 Profit |
Note: For sellers, a rising price is bad for Short Calls (buy-back cost increases) but good for Short Puts (buy-back cost decreases). Delta represents the dollar-for-dollar change in the obligation value relative to the underlying asset.
Master the Option Greeks with the Single Option Pricer and Greek Charts Calculator.
Visualise Delta, Gamma, Theta, Vega and Rho in real time across all four option positions — Long Call, Short Call, Long Put and Short Put. Model different scenarios and watch the Greeks respond instantly.
Trade Like a Professional — Gain Confidence with Data-Driven Decisions to Maximise Profits and Minimise Risk.
Click the "Buy Now" Button and Download the BSM Option Pricer with Greek Charts Today. Available in both Excel and Apple Numbers:
Best of Luck in Your Options Trading,
Ian,
B.Sc. Finance (Hons), UWIST, Wales.
Related Black-Scholes-Merton Options Calculators:
Black-Scholes-Merton 10x Leg Option P & L Master Strategiser
Black-Scholes-Merton Greeks Calculator with Single Option Pricer
Black-Scholes-Merton Options Pricing Calculators (30x Banks)
Black-Scholes-Merton Implied Volatility Calculators (10x Banks)