
Gamma Explained: The Rate of Change in Options Delta
What Are Option “Greeks?”
Greeks Overview:
While Delta tells you how much an Option's price changes, Gamma tells you how fast Delta itself is changing. Understanding Gamma is crucial for managing risk in dynamic market conditions, especially for traders holding multiple positions or complex strategies.
Option Greeks are mathematical measures that describe how different factors will affect the price of an Options contract. These factors include changes in the Underlying Asset's Price, Time to Expiry, Volatility, Interest Rates. The Greeks are essential for traders to understand the risks and potential rewards of options trading.
Gamma Explained in Detail:
1. Gamma (Γ): Sensitivity to Delta Changes
What it Measures:
Gamma measures the rate of change in an Option's Delta with respect to a 1 unit or $1 change in the Underlying Asset Price. It reflects how much Delta will adjust as the underlying price moves.
Universal Gamma Rule: For Long Calls and Long Puts, Gamma is positive, for Short Calls and Short Puts Gamma is negative, both Long and Short Gamma typically peaking for at-the-money (ATM) options and decreasing for in-the-money (ITM) and out-of-the-money (OTM) options.
Gamma’s formula is the same for Calls and Puts. Ranges: Between -1 and +1 for standard Options.
Why Gamma is so Important (see Charts):
1. Gamma changes across different “Moneyness” (ITM / ATM / OTM) levels. Beware, even small Gamma values can compound sharply with large underlying price moves, particularly if the asset price is near to the Strike price (ATM) and option expiry and the DTE is short.
2. Recall that Delta slows as the underlying becomes increasingly more ITM or OTM, Gamma's measure of Delta's rate of change will match, hence Gamma's convexity / concavity.
3. Gamma's Positive or Negative sign is regardless of whether Delta is Positive (Bullish Long Calls and Short Puts) or Negative (Bearish Long Puts and Short Calls) and related to whether the Option position enhances a holders profit, Positive Gamma or increases it's risk, Negative Gamma due to how Delta behaves. More details below.
Overview of Gamma for a Long Call:
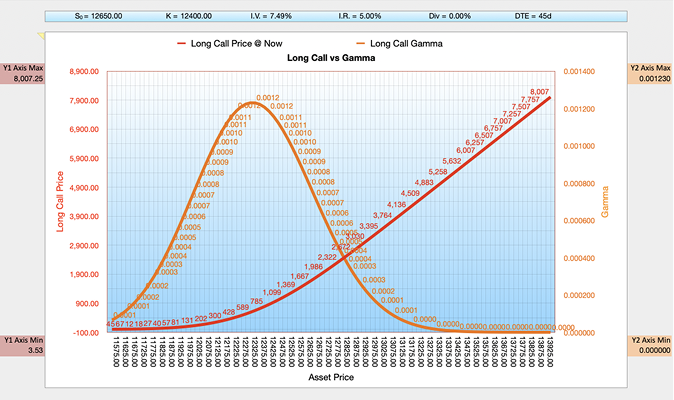
- Long Calls: Gamma measures how much the Delta of an option changes for every 1 unit move in the underlying asset price. If Delta is the speed of a car that is travelling at 50 mph and it accelerates to 70 mph, then Gamma represents the acceleration of 20 mph. Gamma is typically quoted to 6 decimal places.
- For Long Options (Calls or Puts), Gamma is always Positive, which means Delta changes in the buyer's favour enhancing profits.
- The Positive sign for Long Call Option Gamma reflects the fact that the buyers profit increases as the price moves with them, regardless of whether Delta itself is positive (Long Call) or Negative (Long Put).
- Positive Long Gamma indicates that positive Long Call Delta values increase (from 0 towards +1, ITM) as the underlying asset price rises and decrease (from +1 towards 0, OTM) as the underlying falls. Please see the Delta vs Gamma chart below. Gamma reflects how the position becomes more responsive to price changes as the underlying moves and Delta changes.
- This positive relationship between increasing positive Delta and the rising underlying price creates a reinforcing “supercharging” effect: As the underlying moves favourably, upward for a Long Call, the position becomes more sensitive to further gains, amplifying potential profits (refer to the steepest part of the Delta curve).
- Gamma is highest when the Option is at-the-money (ATM) and decreases as the Option moves either deeper in-the-money (ITM) or further out-of-the-money (OTM).
- The goal for buying a Long Call Option is to risk the amount of premium paid (eg $100 paid by the long Call holder, means the maximum loss is limited to the cost of the option) and then hopefully, when the underlying asset price increases above the Strike price, close the contract by selling the option for more, profiting from the difference. The Long Call gives the holder the right, but not the obligation, to obtain the underlying for the Strike price set at time of purchase.
Overview of Gamma for a Short Call:
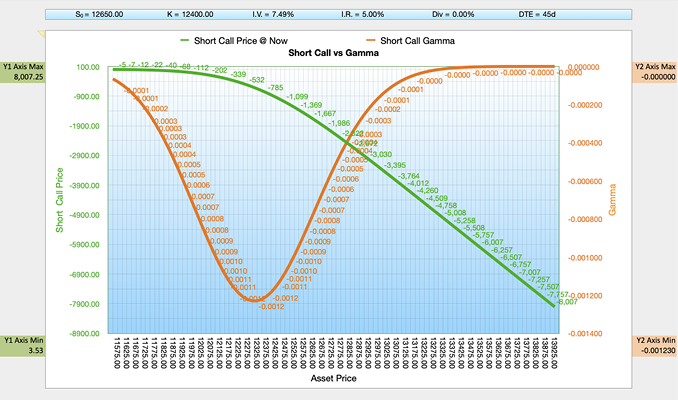
- Short Calls: Gamma measures how much the Delta of an Option changes for every 1 unit move in the underlying asset price. If Delta is the speed of a car that is travelling at 50 mph and it accelerates to 70 mph, then Gamma represents the acceleration of 20 mph. Gamma is typically quoted to 6 decimal places.
- For Short Options (Calls or Puts), Gamma is always Negative, meaning Delta changes in a way that increases risk for the seller.
- The Negative sign for Short Call Option Gamma reflects the fact that the seller's risk increases as the price moves against them, regardless of whether Delta itself is positive (Short Put) or Negative (Short Call).
- Negative Short Gamma indicates that negative Short Call Delta values increase (from 0 towards -1, ITM) as the underlying asset price rises and decrease (from -1 towards 0, OTM) as the underlying falls. Please see the Delta vs Gamma chart below. Gamma reflects how the position becomes more responsive to price changes as the underlying moves and Delta changes.
- This negative relationship between increasing negative Delta and the rising underlying price creates a reinforcing “supercharging” effect: As the underlying moves unfavourably, upward for a Short Call, the position becomes more sensitive to further losses, amplifying potential risks (refer to the steepest part of the Delta curve).
- Gamma is highest when the Option is at-the-money (ATM) and decreases as the Option moves either deeper in-the-money (ITM) or further out-of-the-money (OTM).
- The goal for Writing (selling) a Call Option is to collect the premium upfront (eg $100 paid by the long Call holder) and then hopefully close the contract out by buying it back later for less money, ideally $0 if the option expires worthless because the underlying price stayed below the Strike price.
Overview of Delta vs Gamma for a Long Call:
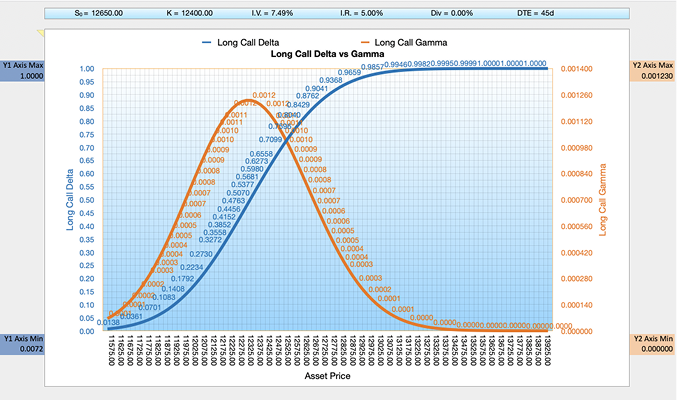
- Explanation Why Gamma is Highest ATM:
The Long Call Delta / Gamma Relationship:
- (i) When the Underlying Asset Price Increases (ITM) :
- The Long Call Option moves further ITM, (above 12400).
- As Delta approaches +1 (ITM), the positive Gamma values begin to decrease by smaller positive numbers. The decline in Gamma as the Option becomes more ITM is due to the diminishing rate of change of Delta in relation to changes in the underlying asset price.
- The decrease in Gamma makes Option prices less sensitive to changes in the underlying asset price, reducing potential profit gains.
- The deeper an Option moves ITM, Gamma decreases because Delta approaches +1 and the rate of change of Delta with respect to the underlying price (Gamma) slows further. As Delta approaches 1 (ITM), Gamma decreases towards 0.
- (ii) At-the-Money (ATM) (12400) :
- At the ATM level, Delta is around 0.5 for Long Calls. This is the point where a small move in the asset price has the largest impact on whether the Option moves ITM or OTM and therefore Delta changes most rapidly.
- Gamma is at its highest when the underlying price is near the strike price (ATM), as this is where the Delta changes most rapidly in response to changes in the underlying asset price.
- (iii) When the Underlying Asset Price Decreases (OTM) :
- The Long Call Option moves further OTM, (below 12400).
- As the Option moves further OTM, Gamma also decreases because Delta approaches 0 and the 0ption price becomes less sensitive to changes in the underlying price.
- For Long Calls (Bullish, Positive Delta) :
- If the underlying price falls → Delta becomes less Positive (and more OTM, e.g., from +0.4 to +0.2), reducing the buyer's sensitivity to changes in the underlying price. Factors that adversely affect the buyer.
- If the underlying price rises → Delta becomes more Positive (and more ITM, e.g., from +0.4 to +0.6), increasing the Option's sensitivity to favourable price movement. All factors that favour the buyer, therefore:
- Positive Gamma causes Delta to change in a way that amplifies profit potential when the price rises in favour of the Long Call buyer.
- Summary:
- Gamma has a bell curve shape relative to the underlying asset price, peaking at ATM and declining as the option moves ITM or OTM. Gamma levels depend on how close the Option is to being ATM.
Overview of Delta vs Gamma for a Short Call:

- Explanation Why Gamma is Highest ATM:
The Short Call Delta / Gamma Relationship:
- (i) When the Underlying Asset Price Increases (ITM) :
- The Short Call Option moves further ITM, (above 12400).
- As Delta approaches -1 (ITM), the negative Gamma values begin to decrease by smaller positive numbers. The decline in Gamma as the 0ption becomes more ITM is due to the diminishing rate of change of Delta in relation to changes in the underlying asset price.
- This reduced Gamma makes the Option price less sensitive to changes in the underlying asset price, slowing the rate at which the seller's position deteriorates.
- The deeper an Option moves ITM, Gamma decreases because Delta approaches -1 and the rate of change of Delta with respect to the underlying price (Gamma) slows further. As Delta approaches -1 (ITM), Gamma decreases towards 0.
- (ii) At-the-Money (ATM) (12400) :
- At the ATM level, Delta is around 0.5 for Short Calls. This is the point where a small move in the asset price has the largest impact on whether the Option moves ITM or OTM and therefore Delta changes most rapidly.
- Gamma is at its highest when the underlying price is near the strike price (ATM), as this is where the Delta changes most rapidly in response to changes in the underlying asset price.
- (iii) When the Underlying Asset Price Decreases (OTM) :
- The Short Call Option moves further OTM, (below 12400).
- As the Option moves further OTM, Gamma also decreases because Delta approaches 0 and the Option price becomes less sensitive to changes in the underlying price.
- For Short Calls (Bearish, Negative Delta) :
- If the underlying price falls → Delta becomes less Negative (and more OTM, e.g., from -0.4 to -0.2), reducing the seller's exposure to changes in the underlying price. Factors that favour the seller.
- If the underlying price rises → Delta becomes more Negative (and more ITM, e.g., from -0.4 to -0.6), increasing the Option's sensitivity to unfavourable price movement. All factors that adversely affect the seller, therefore:
- Negative Gamma causes Delta to change in a way that amplifies the risk when the price rises against the Short Call seller.
- Summary:
- Gamma has a bell curve shape relative to the underlying asset price, peaking at ATM and declining as the option moves ITM or OTM. Gamma levels depend on how close the Option is to being ATM.
Overview of Gamma for a Long Put:
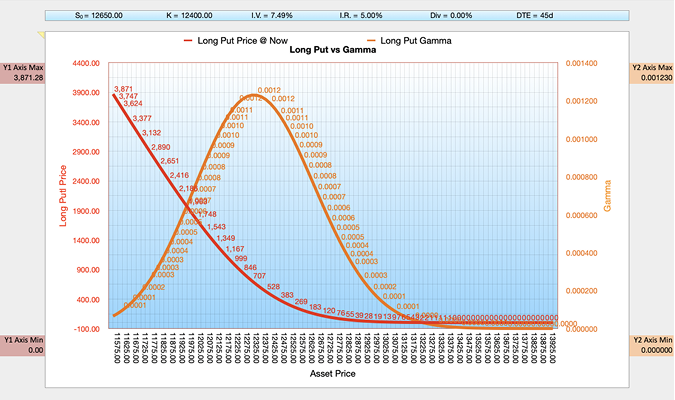
Overview of Delta vs Gamma for a Long Put:
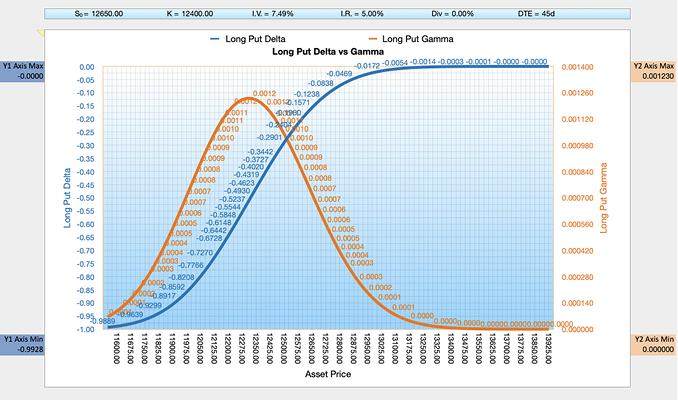
The Long Put Delta / Gamma Relationship:
- Explanation Why Gamma is Highest ATM:
- (i) When the Underlying Asset Price Increases (OTM) :
- The Long Put Option moves further OTM, (above 12400).
- As Delta approaches 0 (OTM), the positive Gamma values begin to decrease by smaller positive numbers. The decline in Gamma as the Option becomes more OTM is due to the diminishing rate of change of Delta in relation to changes in the underlying asset price. This reduced Gamma makes the option price less sensitive to changes in the underlying asset price, limiting the potential to recover value from favourable moves.
- The deeper an Option moves OTM, Gamma decreases because Delta approaches 0 and the rate of change of Delta with respect to the underlying price (Gamma) slows further. As Delta approaches 0 (OTM), Gamma decreases towards 0.
- (i) At-the-Money (ATM) (12400) :
- At the ATM level, Delta is around 0.5 for Long Puts. This is the point where a small move in the asset price has the largest impact on whether the Option moves ITM or OTM and therefore Delta changes most rapidly.
- Gamma is at its highest when the underlying price is near the strike price (ATM), as this is where the Delta changes most rapidly in response to changes in the underlying asset price.
- (ii) When the Underlying Asset Price Decreases (ITM) :
- The Long Put Option moves further ITM, (below 12400). As the Option moves further ITM, Gamma also decreases because Delta approaches -1 and the Option price becomes less sensitive to changes in the underlying price.
- For Long Puts (Bearish, Negative Delta) :
- If the underlying price rises → Delta becomes less Negative (and more OTM, e.g., from -0.4 to -0.2), reducing the buyer's sensitivity to changes in the underlying price. Factors that adversely affect the buyer.
- If the underlying price falls → Delta becomes more Negative (and more ITM, e.g., from -0.4 to -0.6), increasing the Option's sensitivity to favourable price movement. All factors that favour the buyer, therefore:
- Positive Gamma causes Delta to change in a way that amplifies profit potential when the price falls in favour of the Long Put buyer.
- Summary:
- Gamma has a bell curve shape relative to the underlying asset price, peaking at ATM and declining as the Option moves ITM or OTM. Gamma levels depend on how close the Option is to being ATM.
Overview of Gamma for a Short Put:
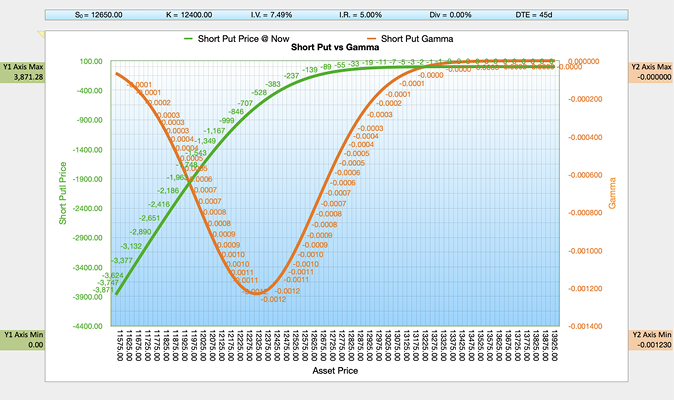
Overview of Delta vs Gamma for a Short Put:
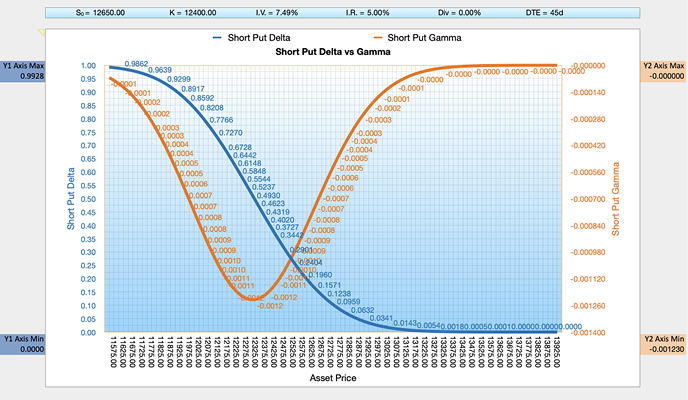
The Short Put Delta / Gamma Relationship:
- Explanation Why Gamma is Highest ATM:
- (i) When the Underlying Asset Price Increases (OTM) :
- The Short Put Option moves further OTM, (above 12400).
- As Delta approaches 0 (OTM), the negative Gamma values begin to decrease by smaller positive numbers. The decline in Gamma as the Option becomes more OTM is due to the diminishing rate of change of Delta in relation to changes in the underlying asset price. The decrease in Gamma makes option prices less sensitive to changes in the underlying asset price, slowing the rate of profit accumulation for the seller.
- The deeper an 0ption moves ITM, Gamma decreases because Delta approaches +1 and the rate of change of Delta with respect to the underlying price (Gamma) slows further. As Delta approaches +1 (ITM), Gamma decreases towards 0.
- (ii) At-the-Money (ATM) (12400) :
- At the ATM level, Delta is around 0.5 for Short Puts. This is the point where a small move in the asset price has the largest impact on whether the option moves ITM or OTM and therefore Delta changes most rapidly.
- Gamma is at its highest when the underlying price is near the strike price (ATM), as this is where the Delta changes most rapidly in response to changes in the underlying asset price.
- (iii) When the Underlying Asset Price Decreases (ITM) :
- The Short Put Option moves further ITM (below 12400). As the Option moves further ITM, Gamma also decreases because Delta approaches +1 and the Option price becomes less sensitive to changes in the underlying price.
- For Short Puts (Bullish, Positive Delta) :
- If the underlying price rises → Delta becomes less Positive (and more OTM, e.g., from +0.4 to +0.2), reducing the seller's sensitivity to changes in the underlying price. All factors that favour the seller.
- If the underlying price falls → Delta becomes more Positive (and more ITM, e.g., from +0.4 to +0.6), increasing the Option's sensitivity to adverse price movement. All factors that adversely affect the seller, therefore:
- Negative Gamma causes Delta to change in a way that amplifies the risk when the price falls against the Short Put seller.
- Summary:
- Gamma has a bell curve shape relative to the underlying asset price, peaking at ATM and declining as the Option moves ITM or OTM. Gamma levels depend on how close the Option is to being ATM.
Overview — Gamma for a Long Call & Put vs 7 Different Days to Expiry:
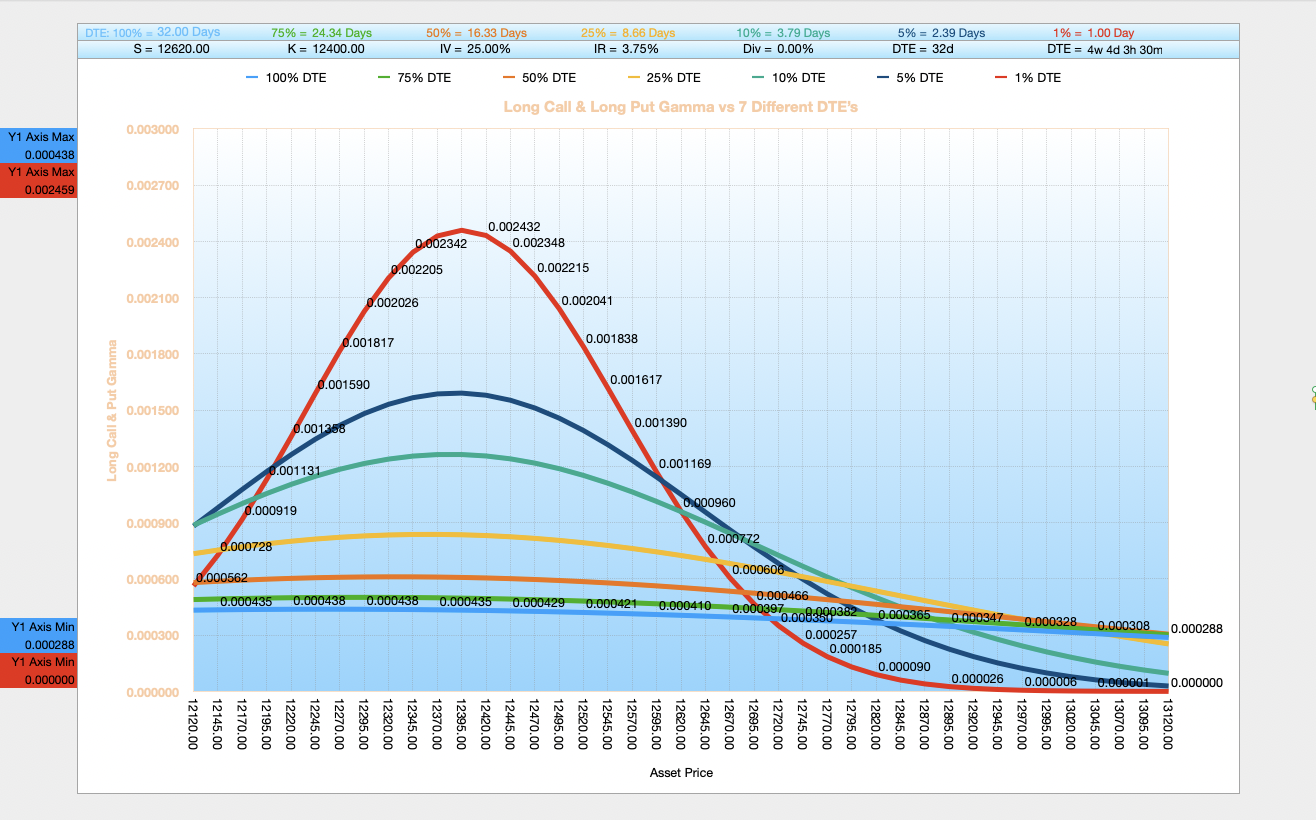
Gamma's Relationship with Theta and Time to Expiration (Days to Expiry) for a Long Call & Put
- (i) Near Expiration:
- Gamma becomes more concentrated around ATM Options as expiration approaches. This results in rapid Delta shifts for even small price movements. Refer to the steep red line on the chart above.
- ITM and OTM Options have diminishing Gamma as the probability of significant price moves decreases.
- (ii) Far from Expiration:
- Gamma is more spread out across Asset Prices and the changes in Delta are smoother for Options near ATM, ITM, or OTM. Refer to the relatively flat pale blue line on the chart above.
Why is Option Gamma Risk is Much Higher for Short-Dated Options?
As we know Gamma measures the rate of change in an Option's Delta with respect to changes in the underlying asset's price. In other words, it tells you how quickly the Option's Delta will change as the underlying asset's price moves. For short-dated options, options with very little time to expiration (DTE), Gamma is typically much higher because:
- (i) Time Decay Impact:
- As an Option approaches expiration, its price becomes increasingly sensitive to changes in the underlying asset's price. This means the Delta changes more rapidly with price movements.
- Narrowing Price Range: With less time left, the potential price movement becomes compressed. This creates a more dramatic change in the Option's value for even small price shifts in the underlying asset.
- Reduced Time Value: Short-dated Options have minimal time value, making them more directly responsive to price changes. The Option's value is almost entirely composed of intrinsic value, which makes it more sensitive to price movements.
- (ii) Mathematical Perspective:
- Gamma tends to peak for ATM (at-the-money Options) with very little time to expiration. Imagine an Option with just days or hours left:
- A small $1 move in the underlying asset can cause a significant change in the Option's Delta.
- The Option becomes essentially a binary bet on whether the asset will be above or below the Strike Price.
- The Delta can swing dramatically from near 0 to near 1 (or vice versa) with minimal price movement.
- Example:
- A long-dated Option might have a Gamma of 0.05.
- The same Option with just a few days to expiration might have a Gamma of 0.5 or higher.
- This means Delta changes much more rapidly as the underlying price moves.
- For Options traders, high Gamma represents both opportunity and risk:
- Opportunity: Potential for quick, significant gains.
- Risk: Potential for rapid, substantial losses.
- Practical implication: Traders holding short-dated Options need to be extremely careful about price movements, as the Option's value can change dramatically and quickly.
- This is why risk management becomes crucial when trading short-dated Options, especially those close to being ATM. The high Gamma means the position can become very volatile very quickly.
Practical Implications for Traders:
- 1. Opportunity:
- Low-IV Options offer potential for rapid Delta shifts, which can create large gains if the market moves unexpectedly.
- 2. Risk:
- Low-IV Options carry heightened Gamma risk because small deviations in price can result in substantial changes in Delta, leading to large potential losses.
- Traders must monitor positions closely, especially for ATM Options, where Gamma is highest.
- 3. Hedging Challenges:
- Dynamic hedging becomes more frequent and costly due to rapid Delta adjustments driven by high Gamma.
Overview — Gamma for a Short Call & Put vs 7 Different Implied Volatilities

Gamma's Relationship with Vega and Implied Volatility (IV) for a Short Call & Put
- (i) Low IV:
- Gamma becomes more concentrated around ATM Options. Small price changes cause more dramatic Delta adjustments, especially close to expiration. See the steep red line on the chart.
- (ii) High IV:
- Gamma is spread more evenly across strike prices, making the shifts in Delta less sharp. Refer to the relatively flat pale blue line on the chart above.
- ATM Options still exhibit the highest Gamma, but the peak is less pronounced compared to low-IV environments.
Why is Option Gamma Risk is Much Higher for Low-Implied Volatility Options?
- (i) Low I.V. means limited Price Movement Expectations:
- Definition: Low-implied volatility (IV) reflects the market's expectation of smaller price movements in the underlying asset.
- Effect on Gamma: Because price movements are expected to be small, even slight deviations from the anticipated range can cause dramatic shifts in Delta, amplifying Gamma risk.
- Why It Matters: The lower the implied volatility, the steeper the Gamma curve, especially for Options that are at-the-money (ATM).
- (ii) Steeper Gamma Curve:
- Definition: For low-IV Options, the Gamma curve is much sharper around ATM strike prices. This is because the market sees less room for error in pricing Options, given the lower volatility assumption.
- Effect on Delta: Delta transitions much more sharply from 0 to 1 (or -1) as the underlying asset's price moves slightly.
- Result: A small move in the underlying asset's price can lead to a significant change in Delta, increasing the position's sensitivity to price movements.
- (iii) Greater Delta Concentration:
- Definition: Low-IV Options have a smaller probability of ending up deep in-the-money (ITM) or out-of-the-money (OTM). This means Gamma is concentrated near the ATM strike price.
- Effect on Option Pricing: Because low-IV Options are tightly focused around ATM strikes, their Delta reacts more sharply to price changes, increasing Gamma's impact.
- Example: A low-IV ATM Option with 0.001 Gamma might still see Delta shift dramatically for even a $1 move in the underlying, given the steepness of the Gamma curve.
- (iv) Mathematical Perspective:
- Gamma Behaviour in Low IV: Gamma peaks when Options are ATM, and this peak becomes sharper as implied volatility decreases.
- Implication: For low-IV Options, the rapid Delta change caused by Gamma is much more pronounced compared to high-IV Options.
- Example:
- Imagine two ATM call Options with identical parameters except for IV:
- High-IV Option: Gamma = 0.02. A $1 price move shifts Delta modestly, making risk manageable.
- Low-IV Option: Gamma = 0.10. The same $1 price move shifts Delta drastically, exposing traders to significant risk.
Why Gamma Risk Management is Crucial:
- Low-IV Options may appear safer due to their lower prices, but the amplified Gamma risk near expiration or ATM means traders must exercise caution. Gamma's small numerical value belies its significant impact when combined with sharp Delta shifts in low-IV conditions.
- This is why traders dealing with low-implied volatility Options must carefully account for Gamma risk, as it can lead to rapid and dramatic position changes with even minor price movements in the underlying asset.
Add / Subtract Gamma to and from Delta:
Long Gamma Examples: Add Gamma When Underlying Asset Price Goes Up
| Position | Delta | Gamma | Delta After 1 Unit Increase | Delta After 1 Unit Decrease |
|---|---|---|---|---|
| Long Call | +0.2900 | +0.008500 | +0.2985 | +0.2815 |
| Long Put | +0.6500 | +0.012000 | +0.6620 | +0.6380 |
Short Gamma Examples: Subtract Gamma When Underlying Goes Up
| Position | Delta | Gamma | Delta After 1 Unit Increase | Delta After 1 Unit Decrease |
|---|---|---|---|---|
| Short Call | -0.1500 | -0.050000 | -0.2000 | -0.1000 |
| Short Put | +0.2500 | -0.001700 | -0.2483 | +0.2517 |
Gamma Impact — The "Acceleration" of Delta:
Long Positions: Gamma Working FOR You (Increasing Sensitivity)
| Position | Moneyness | Initial Delta | Gamma (+$1.00 move) | New Delta | Profit Effect |
|---|---|---|---|---|---|
| Long Call | ITM | +0.85 | +0.02 | +0.87 | Steady Gain |
| Long Call | ATM | +0.50 | +0.05 | +0.55 | Supercharged |
| Long Call | OTM | +0.25 | +0.03 | +0.28 | Accelerating |
| Long Put | ITM | -0.85 | +0.02 | -0.83 | Fading Move |
| Long Put | ATM | -0.50 | +0.05 | -0.45 | Decreasing Exposure |
| Long Put | OTM | -0.20 | +0.02 | -0.18 | Weakening |
Note: For Long positions, Gamma is always Positive. As the underlying price rises, Call Deltas become more positive (closer to 1.00) and Put Deltas become less negative (closer to 0), reflecting how the position's sensitivity reacts to a $1 increase.
Short Positions: Gamma Working AGAINST You (Increasing Risk)
| Position | Moneyness | Initial Delta | Gamma (+$1.00 move) | New Delta | Risk Effect |
|---|---|---|---|---|---|
| Short Call | ITM | -0.85 | -0.02 | -0.87 | Rising Liability |
| Short Call | ATM | -0.50 | -0.05 | -0.55 | Explosive Risk |
| Short Call | OTM | -0.25 | -0.03 | -0.28 | Losing Edge |
| Short Put | ITM | +0.85 | -0.02 | +0.83 | Improving |
| Short Put | ATM | +0.50 | -0.05 | +0.45 | Safe Profit |
| Short Put | OTM | +0.20 | -0.02 | +0.18 | Safety Buffer |
Note: For Short positions, Gamma is Negative. This means a rising stock price makes Short Calls more "short" (higher risk) while making Short Puts less "long" (lower risk as the obligation to buy the stock fades).
Master Gamma and All the Option Greeks with the Single Option Pricer and Greek Charts Calculator.
Visualise Delta, Gamma, Theta, Vega and Rho in real time across all four Option positions — Long Call, Short Call, Long Put and Short Put. Model different scenarios and watch Gamma respond instantly to changes in DTE, IV, and underlying price.
Trade Like a Professional — Gain Confidence with Data-Driven Decisions to Maximise Profits and Minimise Risk.
Click the "Buy Now" Button and Download the BSM Option Pricer with Greek Charts Today. Available in both Excel and Apple Numbers:
Best of Luck in Your Options Trading,
Ian,
B.Sc. Finance (Hons), UWIST, Wales.
Related Black-Scholes-Merton Options Calculators:
Black-Scholes-Merton 10x Leg Option P & L Master Strategiser
Black-Scholes-Merton Greeks Calculator with Single Option Pricer
Black-Scholes-Merton Options Pricing Calculators (30x Banks)
Black-Scholes-Merton Implied Volatility Calculators (10x Banks)