
Vega Explained: The Sensitivity to Implied Volatility
What Are Option “Greeks?”
Greeks Overview:
While Theta tells you how much an Option's price changes in relation to time, Vega tells you how much an Option's price changes with changes in the percentage level of Implied Volatility (I.V.). Understanding Vega is important for managing risk in volatile market conditions, especially for traders holding long options or writing short premium strategies. For more information on Implied Volatility (I.V.) Click Here.
Option Greeks are mathematical measures that describe how different factors will affect the price of an Options contract. These factors include changes in the Underlying Asset's Price, Time to Expiry, Volatility, Interest Rates. The Greeks are essential for traders to understand the risks and potential rewards of options trading.
Vega Explained in Detail:
1. Vega (ν): Sensitivity to Implied Volatility
What it Measures:
Vega (ν) measures the rate of change in an Option's price with respect to a one percentage point change in Implied Volatility (IV), all other factors remaining constant. It represents how much an Option's total premium expands or contracts as the market's expectation of future price movement rises or falls. Vega is always expressed as a positive number — both Long Calls and Long Puts gain value when IV rises.
Universal Vega Rule: For Long Calls and Long Puts, Vega is positive (rising IV increases the Option's value). For Short Calls and Short Puts, Vega is negative (rising IV increases the cost to buy back the position, working against the seller). Vega is greatest for At-The-Money (ATM) options and for options with longer time to expiration.
Vega's formula is shared for both Calls and Puts in the Black-Scholes-Merton model. Ranges: Expressed in currency units per 1% move in IV (e.g., +$0.10 means the Option gains $0.10 of value for every 1% increase in IV).
Why Vega is Important (See Charts):
1. Vega changes across different "Moneyness" (ITM / ATM / OTM) levels. ATM Options have the highest Vega because they possess the greatest proportion of time value — the Option's outcome is most uncertain, so changes in the market's volatility expectation have the greatest pricing impact at this level.
2. Vega decreases as expiration approaches. Unlike Theta, which accelerates near expiry, Vega diminishes as an Option runs out of time. With fewer days remaining, there is less opportunity for volatility to move the underlying price, so IV changes have a diminishing effect on the option's value.
3. Vega's Positive or Negative sign is directly related to whether you are a buyer (Long) or seller (Short) of Options. Long Option holders benefit from rising IV (Vega works for them). Short Option sellers are hurt by rising IV (Vega works against them), which is the primary volatility risk in premium-selling strategies such as covered calls, cash-secured puts, iron condors, and credit spreads.
Overview of Vega for a Long Call:

- Long Calls: Vega measures how much an Option's price increases for every one percentage point rise in Implied Volatility, all else being equal. If the premium of a Long Call is $3.00 today and Vega is +$0.10, then a 1% rise in IV will cause the option to be worth approximately $3.10, purely due to the change in volatility expectation. Vega is typically quoted to 4 decimal places.
- For Long Options (Calls or Puts), Vega is always Positive, meaning rising Implied Volatility increases the Option's value, benefiting the buyer. A rise in IV inflates the premium — the Long Call holder can sell the option for more than they paid.
- The Positive sign for Long Call Vega reflects the fact that the buyer profits from uncertainty — higher IV means the market is pricing in a greater range of potential outcomes, making the option more valuable regardless of direction.
- Positive Long Vega indicates that the Option premium expands when volatility rises. This is especially powerful ahead of known events such as earnings announcements or central bank decisions, where IV typically spikes before the event.
- This creates a powerful dynamic for Long Call buyers: not only can a favourable price move generate profit via Delta, but a rise in IV independently increases the Option's value via Vega — even if the underlying price does not yet move. Please refer to the Delta vs Vega chart below.
- Vega is highest in absolute terms when the Option is at-the-money (ATM) and decreases as the Option moves either deeper in-the-money (ITM), where intrinsic value dominates and sensitivity to IV declines, or further out-of-the-money (OTM), where the option's total premium — and therefore its Vega sensitivity — diminishes.
- The goal for buying a Long Call Option is to risk the amount of premium paid (e.g., $100 paid by the Long Call holder means the maximum loss is limited to the cost of the Option) and then profit when the underlying asset price rises above the Strike price and/or when a rise in IV inflates the premium sufficiently to generate a profitable exit before expiry.
Overview of Vega for a Short Call:

- Short Calls: Vega measures how much an Option's price changes for every one percentage point move in Implied Volatility, all else being equal. For the Short Call seller, rising IV works against them — the option they sold increases in value, meaning they would need to pay more to buy it back. Vega is typically quoted to 4 decimal places.
- For Short Options (Calls or Puts), Vega is always Negative, meaning rising Implied Volatility works against the seller by increasing the cost to close the position. Every increase in IV adds to the seller's unrealised loss, all else being equal.
- The Negative sign for Short Call Vega reflects the fact that the seller collected a fixed premium upfront but now faces the risk that expanding volatility will inflate that premium above what they received, creating a loss if the position is closed early.
- Negative Short Vega indicates that the Short Call position loses value (for the seller) as IV rises. This is the key volatility risk of short Options — an unexpected spike in IV, such as during a market shock or earnings surprise, can immediately push the option's value above the premium collected.
- This creates an adverse dynamic for Short Call sellers: both an adverse price move (Delta risk) and a rise in IV (Vega risk) can independently increase the cost to close the position. A sharp IV spike without any underlying price movement can still result in a loss for the seller. Please refer to the Delta vs Vega chart below.
- Vega is highest in absolute terms when the Option is at-the-money (ATM) — meaning the Short Call seller faces the greatest Vega risk from an ATM position — and decreases as the option moves ITM or OTM.
- The goal for Writing (selling) a Call Option is to collect the premium upfront (e.g., $100 received by the Short Call seller) and then hopefully close the contract by buying it back later for less — ideally $0 if the option expires worthless because the underlying price stayed below the Strike price and IV did not expand adversely.
Overview of Delta vs Vega for a Long Call:

- Explanation Why Vega is Highest ATM:
The Long Call Delta / Vega Relationship:
- (i) When the Underlying Asset Price Increases (ITM) :
- The Long Call Option moves further ITM (above the strike price).
- As the Option moves deeper ITM, Vega decreases because the Option's value is increasingly composed of intrinsic value rather than time value. Intrinsic value is not affected by changes in IV — only the time value component is sensitive to volatility.
- The deeper an Option moves ITM, the less the remaining time value is as a proportion of the total premium, so changes in IV have a progressively smaller impact on the overall Option price.
- (ii) At-the-Money (ATM) :
- At the ATM level, the Option is entirely composed of time value — there is no intrinsic value. This is where Vega is at its maximum, because all of the Option's remaining value is sensitive to changes in Implied Volatility.
- Vega is at its highest when the underlying price is near the strike price (ATM), because this is the point of maximum time value and therefore maximum sensitivity to IV changes.
- (iii) When the Underlying Asset Price Decreases (OTM) :
- The Long Call Option moves further OTM (below the strike price).
- As the Option moves further OTM, Vega also decreases because the Option's total premium shrinks towards zero — there is progressively less time value remaining and therefore less sensitivity to changes in IV.
- For Long Calls (Bullish, Positive Delta) :
- Every 1% rise in IV → the Long Call gains value (positive Vega) regardless of the direction of the underlying price movement. Rising IV inflates the premium that the Long Call holder can sell the option for.
- If the underlying price rises → Delta increases (moves ITM) and generates intrinsic value gains, potentially amplified if IV also rises simultaneously (as often happens in sharply rising markets).
- Positive Vega means the Long Call benefits from rising uncertainty. The buyer can profit from IV expansion independently of any directional move in the underlying asset.
- Summary:
- Vega has a hump shape relative to the underlying asset price, peaking at ATM and declining as the Option moves ITM or OTM. Vega levels depend on how much time value remains in the Option — which is greatest for ATM options.
Overview of Delta vs Vega for a Short Call:

- Explanation Why Vega is Highest ATM:
The Short Call Delta / Vega Relationship:
- (i) When the Underlying Asset Price Increases (ITM) :
- The Short Call Option moves further ITM (above the strike price), which is adverse for the seller.
- As the Option moves deeper ITM, Vega decreases because the Option's value is increasingly intrinsic value rather than time value. The seller now faces increasing Delta-driven losses from intrinsic value growth, but the Vega sensitivity declines — rising IV has less impact in pure dollar terms on a deeply ITM option.
- This reduced Vega makes the deeply ITM Short Call position less exposed to volatility changes but increasingly exposed to Delta-driven losses from the underlying price rise.
- (ii) At-the-Money (ATM) :
- At the ATM level, the Short Call seller faces the maximum Vega risk. Any rise in IV has the greatest impact on the 0ption's price at this point, as all value is time value and therefore fully exposed to volatility changes.
- Vega is at its highest when the underlying price is near the strike price (ATM), representing the greatest IV risk to the Option seller — a spike in IV will most adversely impact an ATM short position.
- (iii) When the Underlying Asset Price Decreases (OTM) :
- The Short Call Option moves further OTM (below the strike price), which is favourable for the seller.
- As the Option moves further OTM, Vega decreases because the Option's total remaining premium shrinks. The seller's Vega exposure diminishes as the Option approaches zero value, though the position becomes progressively less risky from a Delta perspective.
- For Short Calls (Bearish, Negative Delta) :
- Every 1% rise in IV → the Short Call loses value to the seller (negative Vega impact), as the Option they wrote increases in price and becomes more expensive to buy back.
- If the underlying price rises → Delta risk increases (moves ITM), which can combine with a simultaneous IV spike to rapidly amplify losses for the Short Call seller. This dual risk is the key danger of selling calls into rising, volatile markets.
- Negative Vega means the Short Call seller is exposed to rising uncertainty. The seller must ensure that neither a Delta-driven price move nor a Vega-driven IV spike overwhelms the premium collected.
- Summary:
- Vega has a hump shape relative to the underlying asset price, peaking at ATM and declining as the Option moves ITM or OTM. Vega levels depend on how much time value remains in the Option — which is greatest for ATM Options.
Overview of Vega for a Long Put:
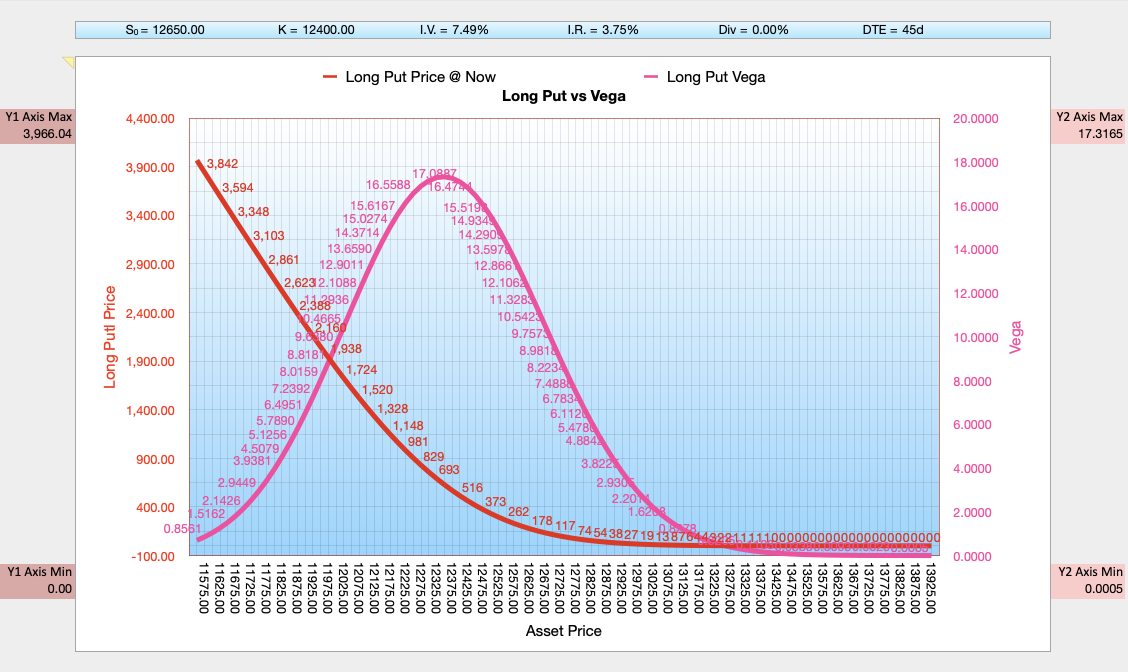
Overview of Delta vs Vega for a Long Put:

The Long Put Delta / Vega Relationship:
- Explanation Why Vega is Highest ATM:
- (i) When the Underlying Asset Price Decreases (OTM) :
- The Long Put Option moves further OTM (above the strike price for a put, i.e., the underlying rises above the strike).
- As the Option moves further OTM, Vega decreases in absolute terms because the total Option premium declines towards zero. With less total premium remaining, there is less time value available to be impacted by IV changes, so the absolute Vega sensitivity diminishes.
- The deeper an Option moves OTM, the lower the absolute Vega because the Option is approaching zero total value — there is simply less remaining premium for IV changes to amplify or compress.
- (ii) At-the-Money (ATM) :
- At the ATM level, the Long Put Option is composed entirely of time value — there is no intrinsic value. This is where Vega is at its maximum because all remaining value is sensitive to IV changes.
- Vega is at its highest when the underlying price is near the strike price (ATM), because this is the point of maximum time value and therefore maximum sensitivity to changes in Implied Volatility.
- (iii) When the Underlying Asset Price Increases (ITM) :
- The Long Put Option moves further ITM (below the strike price). As the Option moves further ITM, Vega decreases because the Option's value becomes increasingly composed of intrinsic value, which is unaffected by changes in IV — only the time value component retains Vega sensitivity.
- For Long Puts (Bearish, Negative Delta) :
- Every 1% rise in IV → the Long Put gains value (positive Vega) regardless of price movement. This is particularly powerful as a crash hedge — market falls typically trigger IV spikes, so Delta gains and Vega gains reinforce each other.
- If the underlying price falls → Delta becomes more negative (moves ITM), generating intrinsic value gains. Simultaneously, the IV spike common in falling markets will amplify the Vega gains, often resulting in explosive option value growth for the Long Put holder.
- Positive Vega causes the Long Put's value to expand in uncertain, volatile market conditions. The buyer benefits most when falling prices and rising IV occur together — a common combination in real market sell-offs.
- Summary:
- Vega has a hump shape relative to the underlying asset price, peaking at ATM and declining as the Option moves ITM or OTM. Vega levels depend on how much time value remains in the Option.
Overview of Vega for a Short Put:
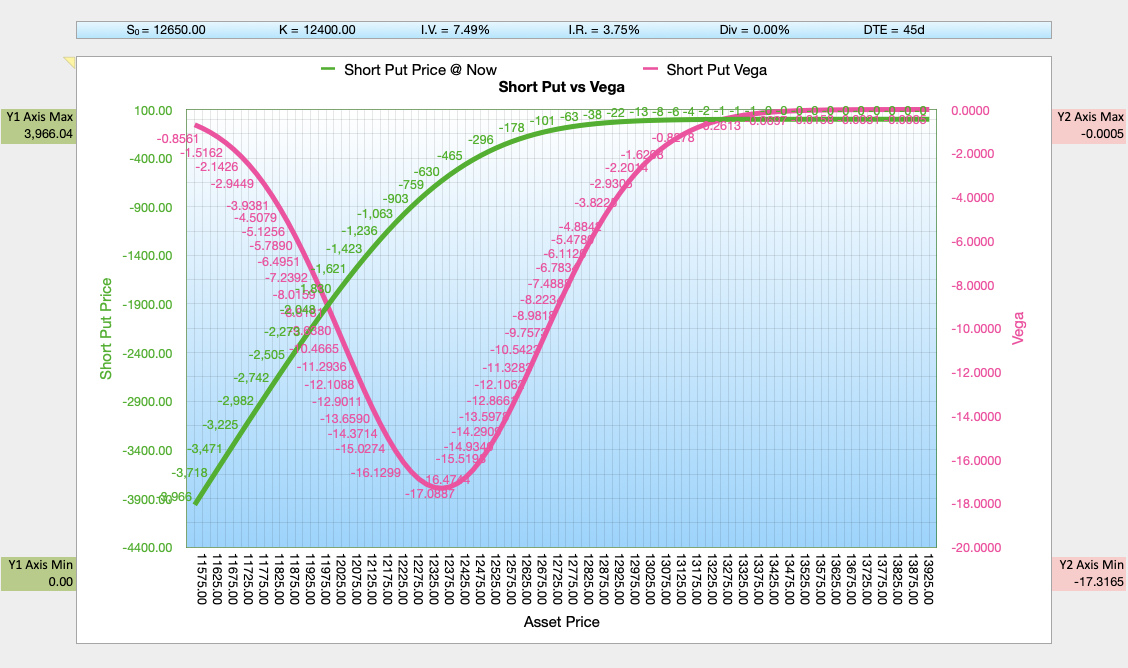
Overview of Delta vs Vega for a Short Put:

The Short Put Delta / Vega Relationship:
- Explanation Why Vega is Highest ATM:
- (i) When the Underlying Asset Price Increases (OTM) :
- The Short Put Option moves further OTM (above the strike price) — this is a favourable direction for the seller.
- As the Option moves further OTM, Vega decreases in absolute terms because the total Option premium declines. The Vega risk diminishes as the Option approaches zero value. The seller benefits from the price direction but faces reduced Vega sensitivity as the premium shrinks.
- The deeper an Option moves OTM, the lower the absolute Vega and the less the seller is impacted by any residual IV changes, though the position becomes progressively less risky overall.
- (ii) At-the-Money (ATM) :
- At the ATM level, the Short Put seller faces maximum Vega risk. All option value is time value and fully sensitive to IV changes — a volatility spike here has the greatest adverse impact on the seller.
- Vega is at its highest when the underlying price is near the strike price (ATM), representing the greatest IV sensitivity for both buyers and sellers of that option.
- (iii) When the Underlying Asset Price Decreases (ITM) :
- The Short Put Option moves further ITM (below the strike price) — this is an adverse direction for the seller. As the Option moves further ITM, Vega decreases because the Option's value is increasingly intrinsic value. However, the seller now faces mounting intrinsic value losses from Delta, and the IV spike that typically accompanies a market decline further amplifies those losses through negative Vega.
- For Short Puts (Bullish, Positive Delta) :
- Every 1% rise in IV → the Short Put loses value to the seller (negative Vega impact), as the Option they wrote increases in price and becomes more expensive to buy back, all else being equal.
- If the underlying price falls → Delta risk increases (Option moves ITM), and the associated IV spike common in falling markets further compounds the seller's losses through negative Vega. This combined Delta and Vega risk is the defining danger for Short Put sellers in volatile market environments.
- Negative Vega causes the Short Put's cost to close to expand in uncertain, volatile markets. The seller must ensure that neither Delta risk nor Vega risk alone — nor both combined — overwhelms the premium collected.
- Summary:
- Vega has a hump shape relative to the underlying asset price, peaking at ATM and declining as the Option moves ITM or OTM. Vega levels depend on how much time value remains in the Option — greatest for ATM options.
Overview — Vega for a Long Call & Long Put vs 7 Different Days to Expiry:
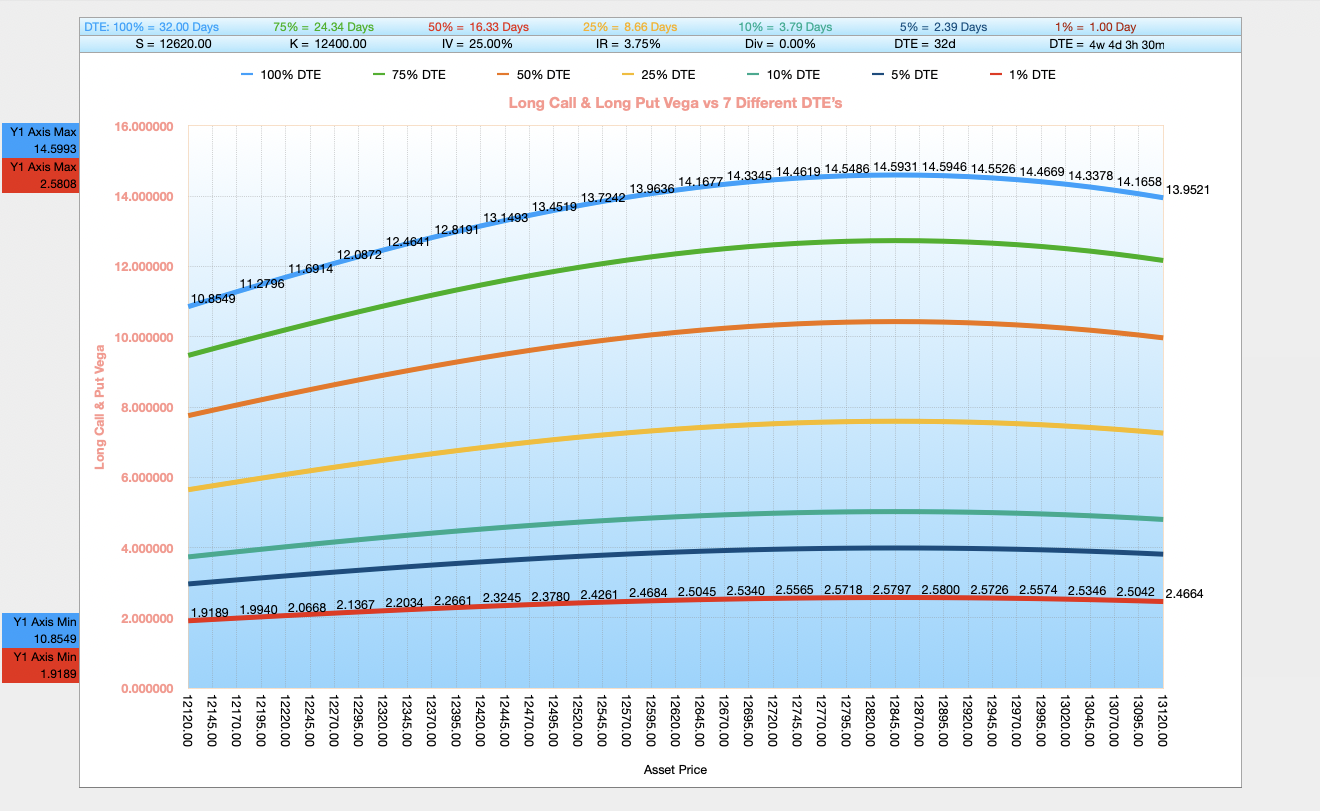
Vega's Time to Expiration (Days to Expiry) Relationship for a Long Call & Long Put
- (i) Near Expiration: (Note: The slope direction of the curves for a Long Put are the same as the Long Call).
- Vega becomes dramatically smaller for ATM Options as expiration approaches. With very little time remaining, even a significant change in IV cannot meaningfully expand the Option's value — there is simply too little time for the underlying to move, regardless of how volatile the market expects the future to be. Refer to the steep downward curve near expiry on the chart above.
- ITM and OTM Options also experience diminishing Vega as expiration nears, because the time value in all options compresses to near zero as expiry approaches — reducing the dollar impact of IV changes across all moneyness levels.
- (ii) Far from Expiration:
- Vega is relatively large and changes more slowly for long-dated Options. The daily Vega sensitivity is substantial and sustained because there is ample time for volatility to affect the option's price over the remaining life of the contract. Refer to the relatively high flat curve on the chart above.
Why is Option Vega Risk Much Higher for Long-Dated Options?
Vega measures the sensitivity of an Option's price to a 1% change in Implied Volatility. For long-dated Options — those with substantial time remaining to expiration — Vega is typically much higher in absolute terms because:
- (i) Time Value Pool Effect:
- Long-dated Options carry substantially more time value than their short-dated equivalents. All else equal, a larger time value pool means that a given change in IV has a larger dollar impact on the Option's price — more premium is available to be inflated or deflated by volatility changes.
- For a long-dated ATM Option, a 1% rise in IV translates to a meaningful dollar gain for the buyer because the Option still has extensive time to benefit from the expanded volatility expectation.
- Expanded Sensitivity Window: With a long time to expiry, the market prices in the possibility that elevated IV will manifest in significant underlying price movement over the full remaining life of the option, making Vega much larger.
- (ii) Mathematical Perspective:
- Vega scales with the square root of time in the Black-Scholes-Merton formula. Specifically, Vega is proportional to √T, meaning doubling the time to expiry increases Vega by a factor of approximately √2 (≈1.41), not by a factor of 2.
- For a long-dated ATM Option, even a modest change in IV can cause a substantial dollar change in the Option's value, because the extended time horizon amplifies the impact of that volatility assumption on the total expected price distribution of the underlying.
- The option pricing model is most sensitive to IV for long-dated positions because the cumulative effect of sustained elevated volatility over months or years of remaining life is extremely significant.
- Vega is therefore not a static risk — it is a risk that diminishes progressively as the Option approaches expiry and time value decays to zero.
- Example:
- A long-dated ATM Option with 180 DTE might have a Vega of +$0.20 per 1% IV move.
- The same ATM Option with just 5 days to expiration might have a Vega of only +$0.02 per 1% IV move.
- This means the long-dated option buyer is ten times more sensitive to IV changes than the short-dated Option buyer — a crucial consideration when trading around volatility events.
- For Options traders, high Vega in long-dated positions represents both opportunity and risk:
- Opportunity: Long Option buyers in long-dated positions benefit most from IV expansion, making them ideal instruments for trading anticipated volatility events or acquiring cheap optionality before a period of expected uncertainty.
- Risk: Short Option sellers in long-dated positions carry the greatest Vega risk — a sustained rise in IV can cause the Option they sold to expand in value well beyond the premium collected, creating significant unrealised losses.
- Practical implication: Traders holding long-dated short Options must be especially mindful of IV levels at the time of sale and the potential for IV to rise over the remaining life of the option. This is why many experienced premium sellers prefer shorter-dated options or manage Vega risk by selling when IV is elevated (so mean reversion reduces the option's value) rather than when IV is historically low.
- This is why Vega risk management is critical for long-dated short Option positions — IV can trend against the seller for sustained periods, creating an ongoing headwind that compounds over the remaining life of the contract.
Practical Implications for Traders:
- 1. Opportunity:
- Long-dated ATM Long Options offer the greatest Vega exposure, making them ideal for trading anticipated volatility events — earnings, central bank decisions, macroeconomic releases — where a rise in IV will expand the option's value independent of any directional move.
- 2. Risk:
- Long-dated short Options carry heightened Vega risk because a sustained rise in IV can inflate the Option's value well beyond the premium collected, creating potentially large unrealised losses for the seller over the life of the contract.
- Traders must monitor IV levels closely relative to the historical and implied volatility environment, especially for ATM short positions where Vega sensitivity is greatest.
- 3. Vega-Theta Trade-Off:
- Vega and Theta work in opposition for Options traders. Long ATM Options carry positive Vega (IV expansion helps) but negative Theta (time decay hurts daily). Short ATM Options carry negative Vega (IV expansion hurts) but positive Theta (time decay generates daily income). This Vega-Theta trade-off is one of the most fundamental relationships in Options trading, and every position involves a choice about which risk the trader prefers to carry.
Overview — Vega for a Short Call & Short Put vs 7 Different Days to Expiry:
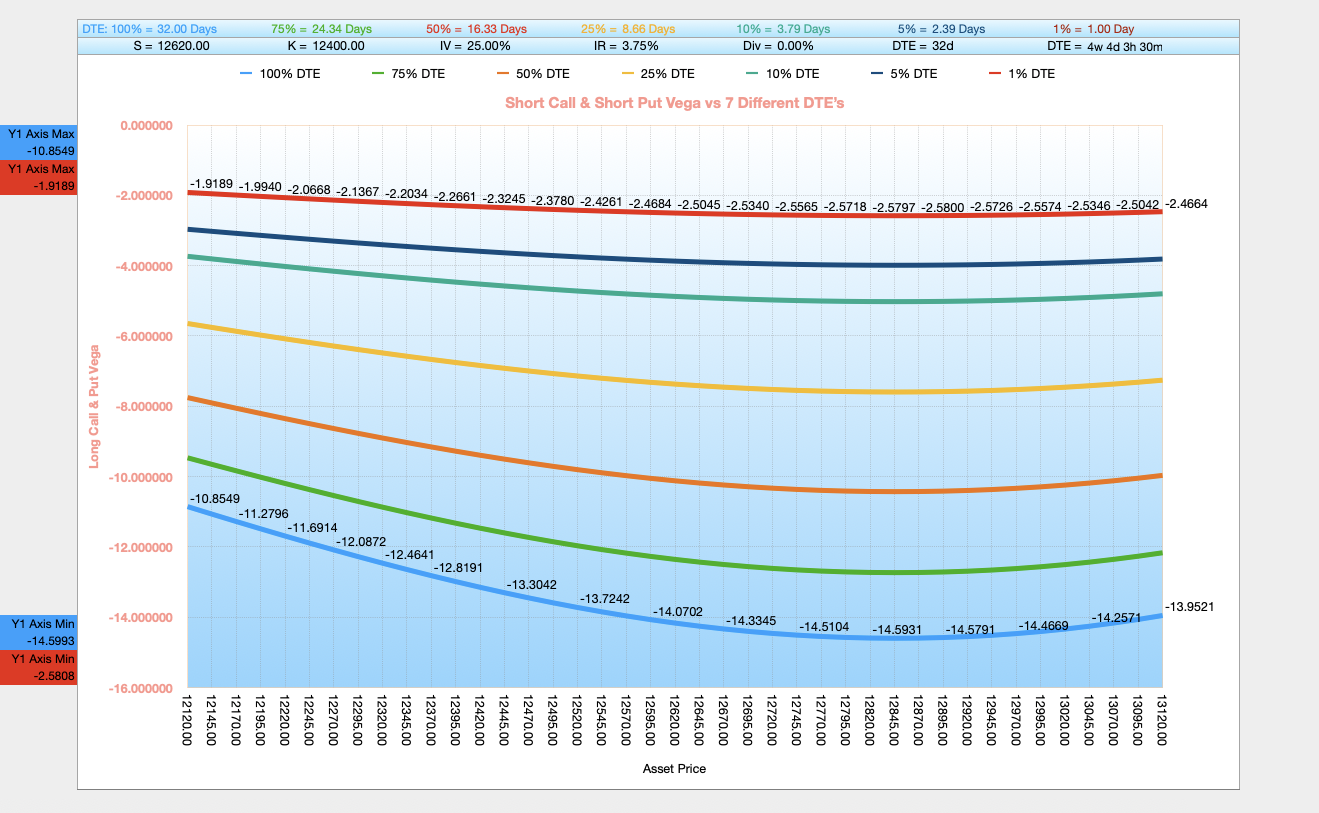
Vega's Time to Expiration (Days to Expiry) Relationship for a Short Call & Short Put
- (i) Near Expiration: (Note: The slope direction of the curves for a Short Put are the same as the Short Call).
- Vega risk falls dramatically for short-dated Short Call and Short Put positions. Near expiry, even a large spike in IV has a limited dollar impact on the Option's value because there is insufficient time remaining for that volatility to materially affect the outcome. This provides short sellers with a natural reduction in Vega risk as expiry approaches. Refer to the steep downward curve near expiry on the chart above.
- ITM and OTM Options experience similarly diminishing Vega near expiry, as the time value in all Options compresses toward zero regardless of moneyness — reducing the IV sensitivity of all positions in the final days before expiry.
- (ii) Far from Expiration:
- Vega risk is at its greatest for short positions that are far from expiry. A sustained rise in IV can significantly inflate the cost to buy back the Option, creating substantial unrealised losses for the seller over the remaining life of the contract. Refer to the relatively high flat curve on the chart above.
Why is Vega Risk Much Higher in High Implied Volatility Environments?
- (i) High I.V. means Elevated Starting Premiums:
- Definition: High implied volatility (IV) reflects the market's expectation of larger price movements in the underlying asset, which inflates Option premiums.
- Effect on Vega: Because premiums are larger in high-IV environments, the absolute dollar impact of each 1% IV change is also larger. Vega scales proportionally with the level of IV — higher IV means more premium at risk from further IV changes.
- Why It Matters: Buying Options in high-IV environments is often referred to as "buying expensive Options" — you pay elevated Vega, meaning you need a further rise in IV (or a large directional move) to profit. Selling Options in high-IV environments collects elevated Vega premium but requires the seller to manage the risk of IV remaining elevated or rising further.
- (ii) IV Mean Reversion and Vega:
- Definition: IV tends to mean-revert — spikes in IV are typically followed by a decline back toward historical averages. For Short Option sellers, this works in their favour on Vega: they collected elevated premium when IV was high, and a subsequent decline in IV reduces the option's value through negative Vega, adding to the seller's profit.
- Effect on Short Sellers: Selling Options after an IV spike can be a highly profitable strategy, earning both Theta decay (from the passage of time) and Vega-driven compression (from the decline in IV) simultaneously.
- Result: Timing short Option sales to coincide with elevated IV periods maximises the Vega premium collected and increases the probability of a favourable IV mean-reversion contributing to the seller's profit.
- (iii) Greater Total Time Value in High-IV Options:
- Definition: High-IV Options contain substantially more time value than the same strike in a low-IV environment, because the market prices in more potential movement before expiry.
- Effect on Vega: A larger time value pool means each 1% IV change has a greater dollar impact on the Option's price. All else equal, Vega scales approximately proportionally with IV levels. Doubling IV roughly doubles the premium and thus the dollar Vega sensitivity for buyers and sellers alike.
- Example: A high-IV ATM Long Option might gain $0.40 per 1% IV rise. The same Option in a low-IV environment might gain only $0.10 per 1% IV rise — a fourfold difference in dollar Vega sensitivity.
- (iv) Mathematical Perspective:
- Vega Behaviour in High IV: Because Black-Scholes Option pricing is directly proportional to IV, higher IV produces higher premiums and therefore larger Vega sensitivity in absolute dollar terms. Vega and the option price move together — as IV rises, both the premium and the Vega grow.
- Implication: In high-IV environments, the premium value at risk from further IV moves is much more pronounced in dollar terms, creating both larger profit opportunities for option buyers on further IV expansion, and larger loss risks for Option sellers if IV fails to decline as expected.
- Example:
- Imagine two ATM Call Options with identical parameters except for IV:
- Low-IV Option: Premium = $1.00, Vega = +$0.04 per 1% IV move. A modest Vega sensitivity for the buyer; limited Vega risk for the seller.
- High-IV Option: Premium = $4.00, Vega = +$0.16 per 1% IV move. Significant Vega sensitivity for the buyer — attractive if IV continues rising; substantial Vega risk for the seller if IV remains elevated or rises further.
Why Vega Risk Management is Crucial:
- High-IV environments may appear attractive for selling Options due to elevated premium collection, but they also carry elevated Vega risk — the same high IV that makes the premium attractive can spike further on unexpected events, immediately inflating the cost to close the position beyond the premium collected. A seemingly profitable short premium position can turn into a significant loss if IV continues to rise after the sale.
- This is why traders dealing with high-implied volatility Options must carefully account for the relationship between the premium collected and the elevated Vega risk they are taking on. Collecting Vega premium in a high-IV environment requires robust risk management to ensure that a continued IV expansion or a combined Delta and Vega shock does not exceed all accumulated premium gains.
Vega Sensitivity — Long & Short Positions (Per 1% Change in IV):
Long Position Examples: Vega Gain per 1% IV Rise (Volatility Working For You)
| Position | Moneyness | Option Premium | Vega (per 1% IV) | Premium After +1% IV | Premium After +5% IV |
|---|---|---|---|---|---|
| Long Call | ITM | $5.8000 | +$0.0880 | $5.8880 | $6.2400 |
| Long Call | ATM | $3.0000 | +$0.1200 | $3.1200 | $3.6000 |
| Long Call | OTM | $1.2000 | +$0.0720 | $1.2720 | $1.5600 |
| Long Put | ITM | $5.5000 | +$0.0880 | $5.5880 | $5.9400 |
| Long Put | ATM | $2.8000 | +$0.1200 | $2.9200 | $3.4000 |
| Long Put | OTM | $1.1000 | +$0.0660 | $1.1660 | $1.4300 |
Note: Vega is highest for ATM Long Options where all value is time value and therefore maximally sensitive to IV changes. ITM Options carry significant intrinsic value which is unaffected by IV, so Vega is lower. OTM Options have less total premium, so their absolute Vega sensitivity is also lower — but a sharp IV spike can still meaningfully inflate even a small OTM Option's value.
Short Position Examples: Vega Cost per 1% IV Rise (Volatility Working Against You)
| Position | Moneyness | Premium Collected | Vega (per 1% IV) | Cost After +1% IV | sCost After +5% IV |
|---|---|---|---|---|---|
| Short Call | ITM | $5.8000 | -$0.0880 | $5.8880 | $6.2400 |
| Short Call | ATM | $3.0000 | -$0.1200 | $3.1200 | $3.6000 |
| Short Call | OTM | $1.2000 | -$0.0720 | $1.2720 | $1.5600 |
| Short Put | ITM | $5.5000 | -$0.0880 | $5.5880 | $5.9400 |
| Short Put | ATM | $2.8000 | -$0.1200 | $2.9200 | $3.4000 |
| Short Put | OTM | $1.1000 | -$0.0660 | $1.1660 | $1.4300 |
Note: Vega risk is highest for ATM Short Options. ITM short Options carry significant intrinsic value Delta risk but have lower Vega sensitivity. OTM short Options are lower risk overall and also carry less Vega sensitivity — the buy-back cost is already low and approaches zero. For all short positions, a rise in IV increases the buy-back cost, working against the seller's profit.
Master Vega and All the Option Greeks with the Single Option Pricer and Greek Charts Calculator.
Visualise Delta, Gamma, Theta, Vega and Rho in real time across all four Option positions — Long Call, Short Call, Long Put and Short Put. Model different scenarios and watch Vega respond instantly to changes in IV, DTE, and underlying price.
Trade Like a Professional — Gain Confidence with Data-Driven Decisions to Maximise Profits and Minimise Risk.
Click the "Buy Now" Button and Download the BSM Option Pricer with Greek Charts Today. Available in both Excel and Apple Numbers:
Best of Luck in Your Options Trading,
Ian,
B.Sc. Finance (Hons), UWIST, Wales.
Related Black-Scholes-Merton Options Calculators:
Black-Scholes-Merton 10x Leg Option P & L Master Strategiser
Black-Scholes-Merton Greeks Calculator with Single Option Pricer
Black-Scholes-Merton Options Pricing Calculators (30x Banks)
Black-Scholes-Merton Implied Volatility Calculators (10x Banks)